

The Best of Loans (and CLOs) Are Made in the Worst of Times and the Worst of Loans Are Made in the Best of Times
The leveraged loan asset class had its largest primary issuance in history in 2021 and in 2022 institutional new issuance has dropped nearly 40% YTD. While the credit story for loans issued in 2021 is barely written, the economics of loans issued in March 2022 was eye popping.
As triple-A (AAA) CLO liabilities widened, the CLO market ceased to represent the overwhelming majority of demand for primary loans. Instead, retail funds became a much larger percentage of new issue demand despite only representing 10% of the total loan market size. Weaker overall demand in the beginning of the month forced dealers to syndicate deals at deep discounts.
In order to syndicate deals, dealers increased OIDs dramatically and primary loans were being offered at levels in the mid-to-high 90s. At the same time we saw loan spreads widen, on average, nearly 50 basis points (bps) for double-B borrowers (compared to December 2021) and nearly 75 bps wider for single-B borrowers (compared to December 2021). In addition to spreads widening, the 3-Month LIBOR climbed from 50 bps to 96 bps in March. 3-month SOFR also increased from 41bps to 68 bps. As can be seen below in the constituency of the Index, roughly 92% of the loan collateral is still based on LIBOR while 8% is based on SOFR.
Index Profile
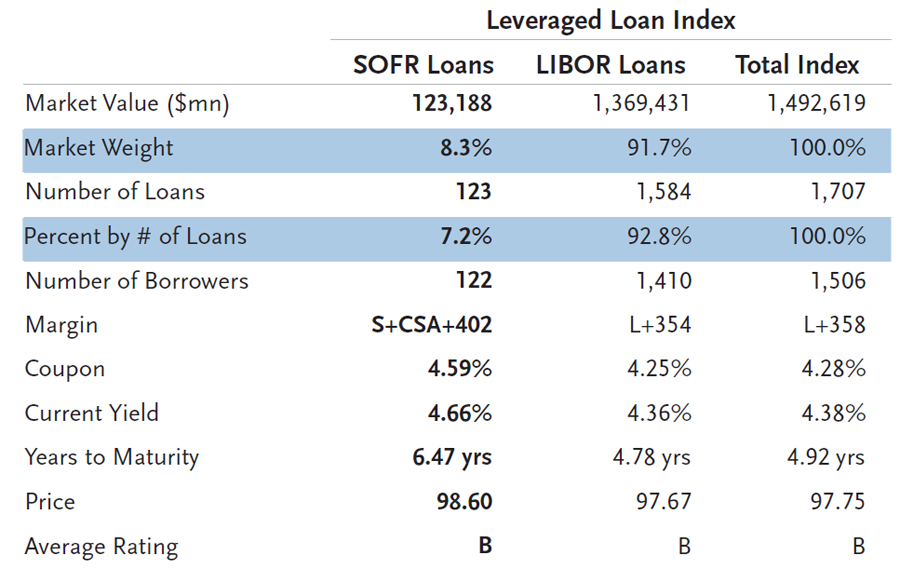
Source: Nelson Jantzen, JP Morgan Research
During the month of March, investors also saw an improvement of non-economic terms. New issue credit agreements tightened language. Traveling capital structures, restricted payment baskets and covenants all tightened while amortization payments were added. Credit agreements actually restricted borrowers from doing things that they really should not be allowed to do in the first place but, alas, that is a conversation for another day.
Another prominent storyline of March was the jump in base rates. Interest rates in March made their mark on the loan asset class as 3-month LIBOR jumped 46 bps and 3-month SOFR jumped 27 bps. For investors that held an L+175 loan with a 0% floor, the all-in coupon increased 20% in March. This growing coupon has spurred on increased flows to retail funds. However, it will also increase the interest burden for loan borrowers.
TCW reviewed 370 of our borrowers, modeling a 500 bps increase in their base rates. This resulted in just 8% of borrowers declining from positive free-cash-flow to negative free-cash-flow.
Finally, the volatility of the loan and CLO market has made managing the arbitrage more difficult. Managers with full warehouses heading into February and March were likely forced to print a lower IRR. Managers who opened warehouses during the darkest days of February and March were rewarded and have already seen a multi-point increase in secondary loan prices.
Performance – Loans
In March, the Credit Suisse Leveraged Loan Index (CS LLI) and the S&P Leveraged Loan Index (S&P/LSTA) were up 0.04% and 0.05%, respectively.
- In Q1 2022, the CS LLI was down -0.10% and the S&P/LSTA was down -0.10%.
- For the 12 months ending March 31, the CS LLI was up 3.22% and the S&P/LSTA was up 3.25%.
In March, higher quality outperformed lower quality as we saw split double-Bs and split triple-Bs outpace all segments with 0.32% and 0.20% returns. Double-Bs and single-Bs produced 0.14% and 0.02%, respectively. Distressed loans were down nearly 2% for the month.
On an LTM basis, triple-Cs outperformed all categories with 5.09% return. Meanwhile, double-B loans and single-B loans produced 2.15% and 3.52% returns, respectively.
Total Return by Rating
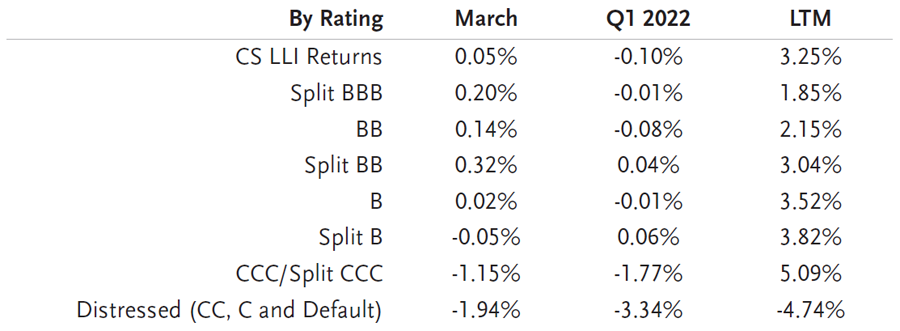
Source: Credit Suisse Leverage Loan Index
Sector Performance
In March, eight sectors in the CS LLI produced positive returns with the trend of tightening dispersion between the top and bottom sectors remaining intact; 127 bps separated the two, decreasing from 157 bps in the prior month. Utility, Energy and Media/Telecommunications led all categories during the month with returns of 0.84%, 0.42% and 0.26%, respectively. The bottom performing sectors were Retail, Chemicals and Forest Products/Containers with total returns of -0.39%, -0.40% and -0.43%, respectively.
In the last 12 months, Metals/Minerals, Energy and Aerospace have led all sectors with total returns of 9.79%, 6.95% and 4.17% while Media/Telecommunications, Food/Tobacco and Utility provided the worst performing sector returns: 2.42%, 1.47% and 1.41%.
Industry Returns
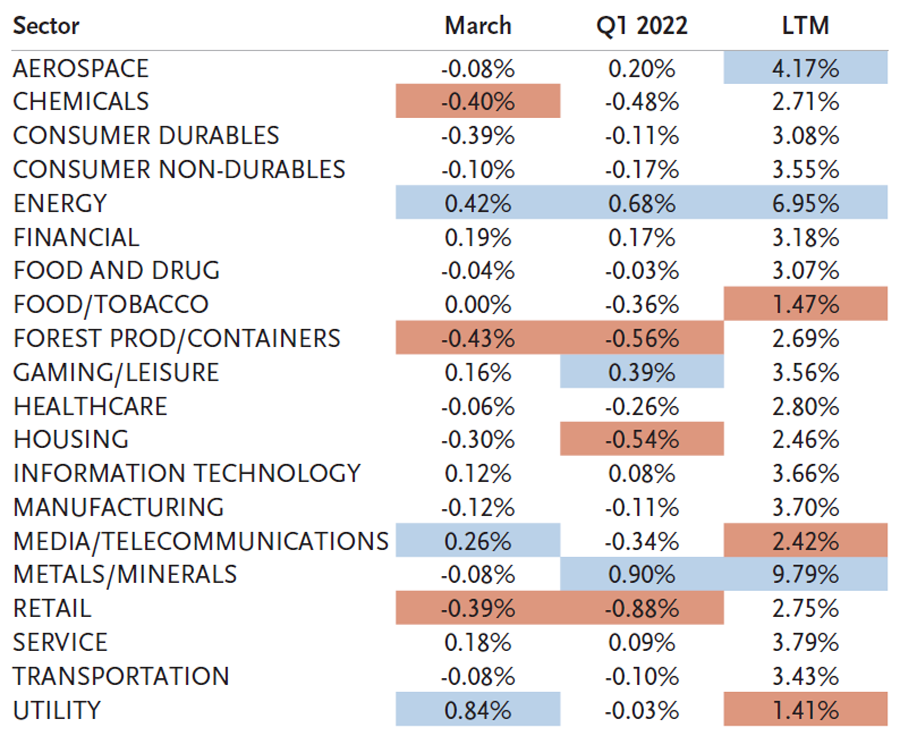
Source: Credit Suisse Leveraged Loan Index
The average bid of the S&P LCD flow-name loan composite increased from 98.53 on March 3 to 99.05 by April 7. Loans continued February’s downward trend until March 15 before prices began grinding higher. During the same period the broader CS LLI increased 6 bps. Over $11 billion of CLOs printing, combined with continued retail inflows, created enough demand to push loan prices higher in the back half of the month.
Average Loan Flow-Name Bid
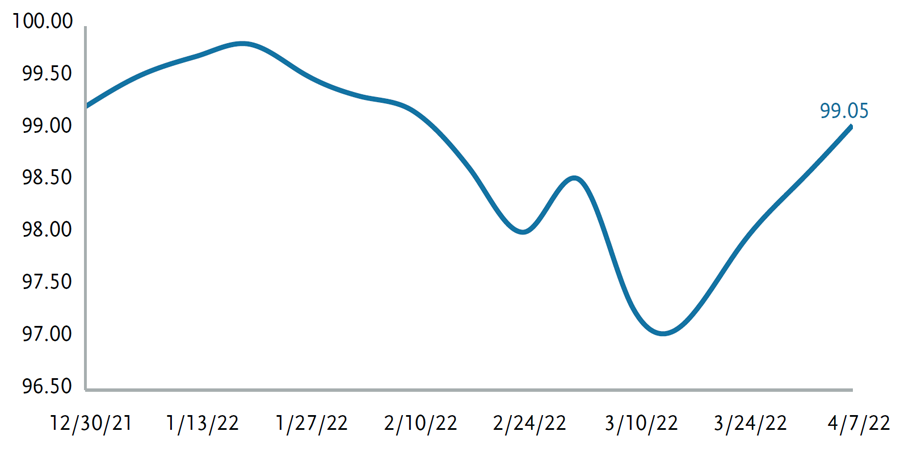
Source: Leveraged Commentary & Data (LCD)
Performance – CLOs
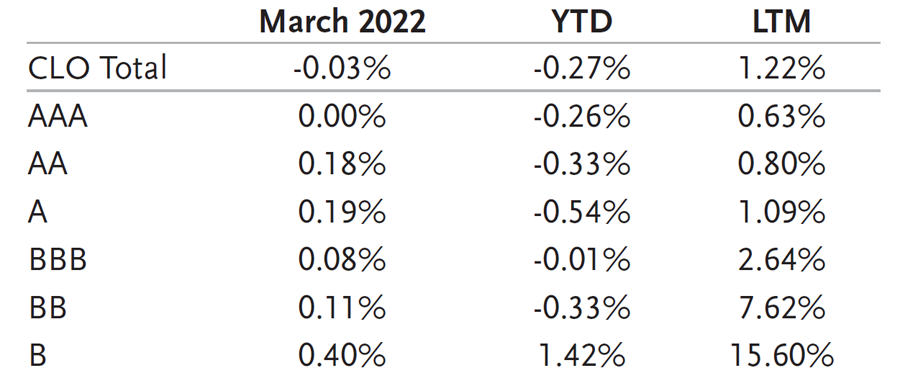
CLO performance was essentially flat in March; although there was plenty of volatility to account for during the month, especially at the top of the stack where we saw the most supply/activity. CLO secondary volumes hit record levels outside of March 2020 with IG volumes of over $18 billion (+37% m-o-m) and BWIC activity surpassing $7 billion (+40% m-o-m). Overall, CLOs returned -0.03% in March as the negative returns from spread widening were cancelled out from the carry earned. CLOs outperformed IG (-2.51%) and HY (-1.15%) and slightly underperformed Loans (+0.05%). On a year to date basis, CLOs are retuning -0.27%, outperforming IG (-7.42%) and HY credit (-4.84%) and underperforming Loans (-0.10%).
Secondary CLO 2.0 Total Returns
Source: J.P. Morgan CLOIE Index
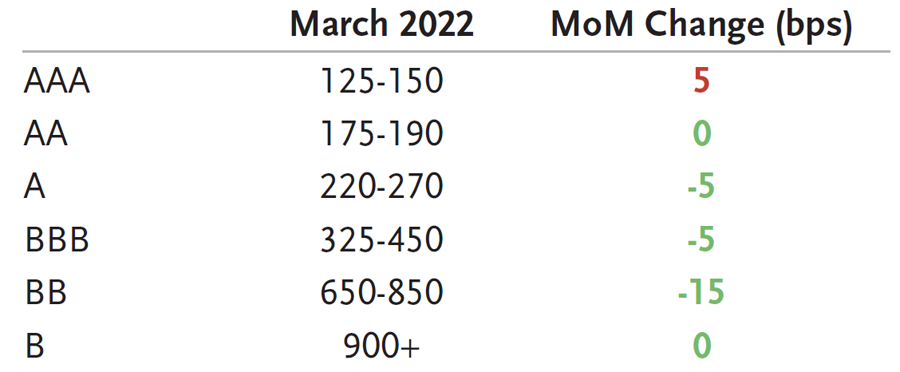
CLO AAA trading took up most of the attention over the month as the volatility initiated in late February continued into March. Investors looked to sell AAAs either to rotate into other asset classes or to raise cash as AAA spreads held in better than those of their peers (i.e., IG corps and other securitized credit). As a result, we saw some of the highest trading volume days on record in AAAs during the month. Encouragingly, the supply was met with decent demand most likely due to the fact that there was little to no issuance in the primary market for buyers to contend with. Spreads widened 10-15 bps during the month with tier 1 AAAs trading in the low to medium 140s DM. As spreads in other sectors remediated towards the end of the month and loan prices rebounded, selling decreased and AAA spreads tightened ~10 bps to end the month in the high 120s/low 130s.
AA and single-A volume was slightly elevated in March as well; however, spread widening was limited given the already wider spreads going into the month from February. Tier 1 AAs remained in the 180s with some prints in the 190s during periods of higher episodic volatility. Single-As were tighter by 5 bps with Tier 1 names in the low to medium 200s DM. Limited supply coupled with low primary issuance kept a lid on single-A spreads and added scarcity value for those bonds when out for bid.
BBB and BB spreads were tighter as positive technicals of limited supply in primary and secondary, coupled with the recovery in loan prices, helped to support spreads. As opposed to the 37% increase in IG volumes, below IG volumes declined 3.5% over the month, as investors were reluctant to sell into volatility and buyers were keen to add.
CLO equity trading declined significantly in March with hardly any secondary activity going through. Given the whipsaw in loan prices, CLO equity NAVs gyrated from down 20 points when loans hit lows not seen since December 2020 to back up 15 points by month end as loans reclaimed much of their losses. As such, trading came to a standstill as investors looked to wait out for calmer markets before attempting to sell or buy in a 10x levered asset.
Secondary CLO 2.0 Spreads (LIBOR)
Source: TCW
Technical Conditions – Loans
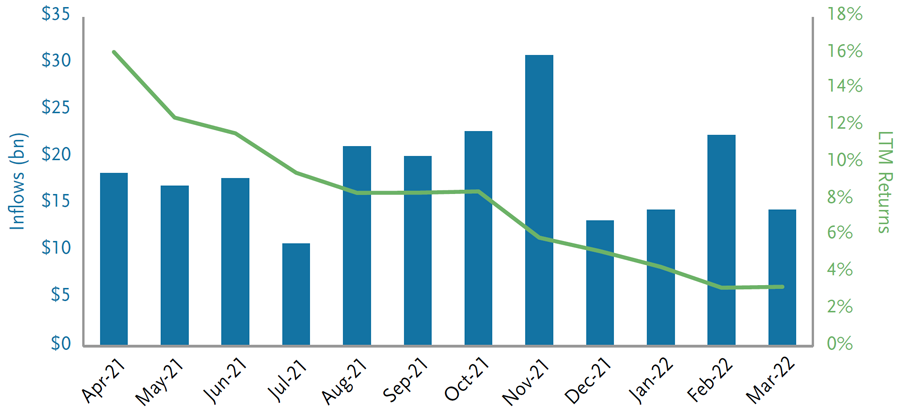
March inflows remained strong despite declining from a monthly 2022 run-rate of approximately $9 billion to roughly $3 billion. While investors remained interested in finding investments with little interest-rate duration, the level of flows were impacted by a broader risk-off environment in credit and equity. Retail funds have reported $68 billion of inflows since the beginning of 2021, following $86 billion of outflows from Q3 2018 to Q4 2020. AUM for the loan mutual fund base is now $140 billion versus $69 billion at year end 2020.
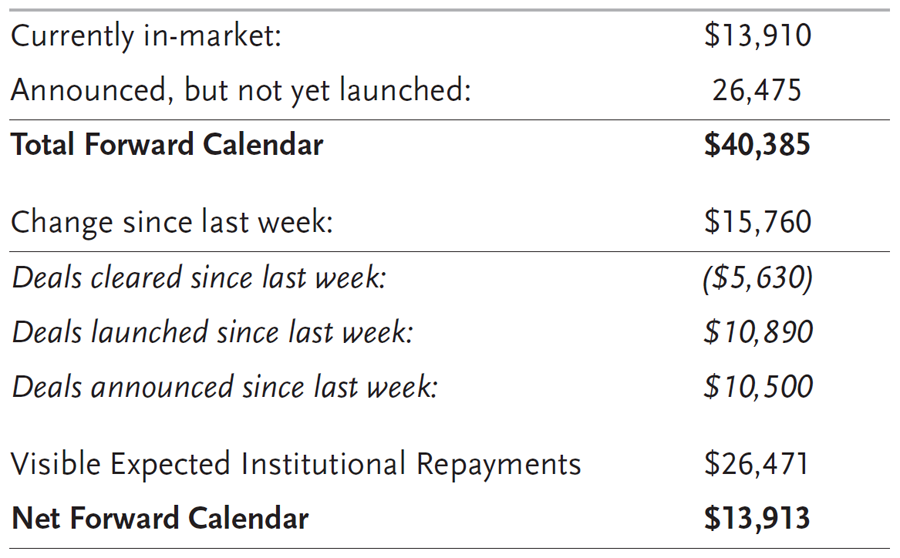
New issuance continues to pace at a surprisingly strong level with nearly $14 billion in the net forward calendar. We have also begun to see an uptick in amendments focused on transitioning borrowers from LIBOR-based deals to SOFR. While most new issue based on SOFR carries a CSA, the amendments thus far seem to skip that offering. We will see if lenders push back against that as the differential between SOFR and LIBOR is roughly 20 bps.
Summary Institutional Loan Data ($ in millions)
Source: Credit Suisse Distribution
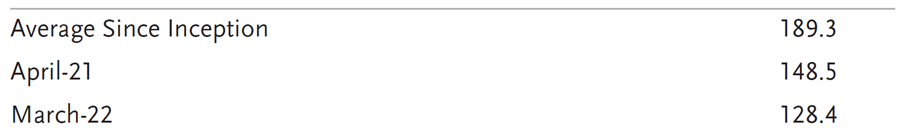
LTM returns have dropped to just 3.25% down from 16.1% in April 2021. In the chart below, LTM returns declined dramatically as the average price in the index approached par and then more recently declined again with loan prices declining in March and February.
Inflows vs. Returns
Source: LCD, an offering of S&P Global Market Intelligence
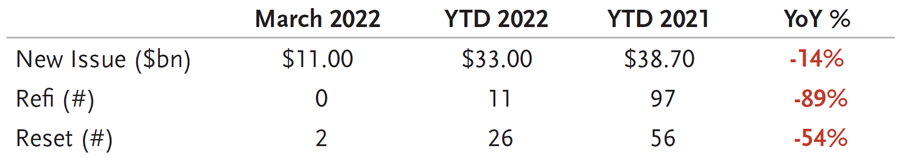
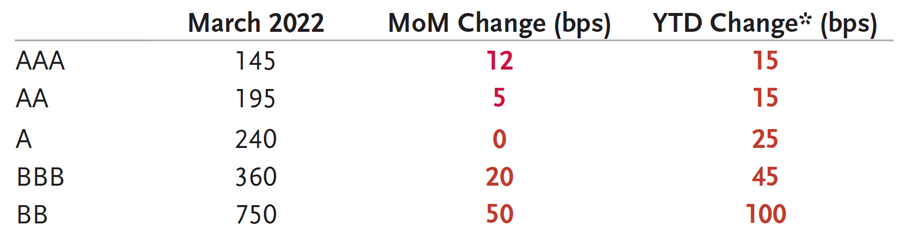
Technical Conditions – CLO Primary Primary CLO issuance declined in March amid heightened geopolitical turmoil, macro volatility and better relative value in the secondary market. The market saw $11 billion in new issue volume, down 34% from February, bringing YTD issuance to $33 billion, down 14% year over year. New issuance was in price discovery mode for the majority of March, with 5-year reinvest spreads only seeming to settle during the last week of the month, given limited new issue prints. Primary spreads closed out March wider for Tier 1, 5-year reinvest deals with AAAs at SOFR +145 bps, AAs at +195 bps, As at +240 bps, BBBs at +360 bps, and BBs at +750 bps.
The CLO market saw no refis over the month and only two resets, both of which were middle market deals. Refi/resets have been nearly absent from the market since mid-February, which has been a large contributor to this year’s modest pace of issuance.
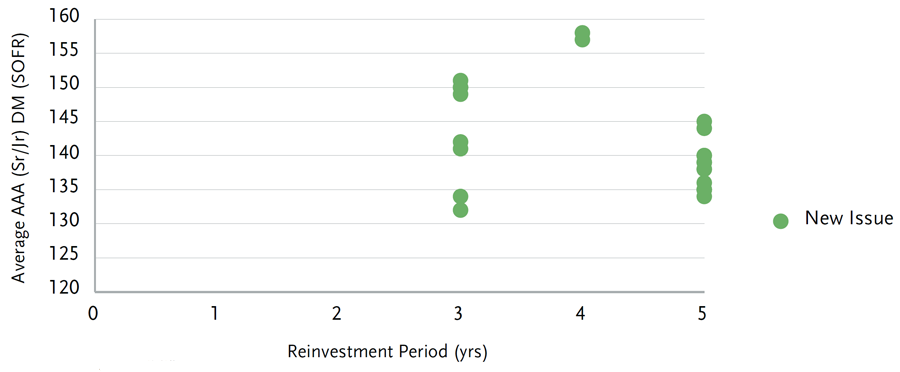
Manager tiering has also become increasingly pronounced, with top tier managers mostly opting for 5-year reinvest deals while lower tier managers have had to issue shorter, 3-year reinvest deals in order to save on liability costs. The current landscape has effectively inverted the AAA term curve, as numerous 3-year reinvest deals from lower tier managers are pricing 5-10 bps wider than 5-year reinvest deals from top tier managers. Given higher uncertainty around execution, many AAAs on recent deals have mostly been pre-placed before being announced. Syndicated deals are having more trouble getting done with many requiring concessions from managers in order to place the AAAs. Concessions range from AAAs being offered at discount, make-whole provisions, higher credit enhancement, longer non-call periods and wider spreads. Managers have continued to get creative to bring new issue deals to market with investors seeing better value in secondary and the ability to source size in secondary from heightened supply.
CLO New Issuance
Source: TCW
Tier 1 New Issue Spreads (SOFR)
Source: TCW *Assuming 15 bps LIBOR/SOFR basis
New Issue BSL AAA DM – March 2022
Source: TCW
Fundamentals – Loans
Lagging 12-Month Default Rates
*Shadow default rate includes potential defaults, including those companies that have engaged
bankruptcy advisors, performing loans with SD or D corporate rating and those paying default interest.
Source: LCD, an offering of S&P Global Market Intelligence
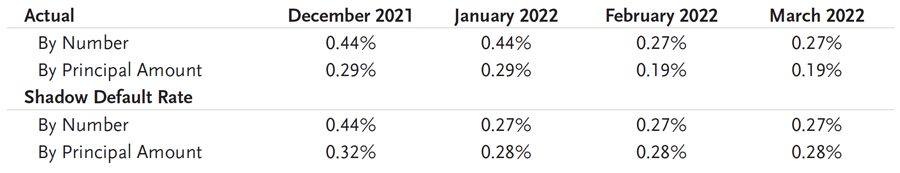
There were no defaults in the first quarter and only three in the last 12 months. There has been one default each in Information Technology, Telecom, and Oil & Gas. Clearly the costs of goods sold for so many industries have increased dramatically. Thus far, most industries have been able to pass these costs on – worst case with a one or two quarter lag. Also these costs being passed on simply spill into inflation. This combined with the increase in financing costs will lead to more stressed borrowers in the next several quarters.
The default rate of the S&P/LSTA, by issuer count, remained flat at 0.27% while the default rate based on par outstanding also remained flat at 0.19%.
Fundamentals – CLOs
Credit metrics have remained mostly unchanged month over month while market value metrics were volatile from loan price movement. WARF levels increased by 5 bps over the month to 2,779. The percentage of defaulted assets has remained near zero, and CCC exposure increased to 4.1% from 3.9% in February. Junior OC cushions increased 10 bps to 450 bps. Loan market weakness caused equity NAVs to drop 4 pts over the month to 55.7 while BB MVOCs dropped to 106 from 107 in February. The percentage of loans trading above par remains <1%, and the percentage of B- loans in CLO portfolios remains flat although still at historical highs of 27%. As we have seen an increase in CCC baskets, we continue to watch B-concentrations closely.
Throughout March, a few mezzanine 2.0 tranches have been classified as either defaulted or near-default by S&P, mostly from the 2014 and 2015 vintages. Principal impairment was mainly due to meaningful par burn since deal inception, continued deterioration in collateral performance during the COVID period and higher defaults due to a larger share of concentrated loan positions, including in energy and retail. Despite the uptick, the amount of tranche defaults in CLOs remains extremely low compared to the number of outstanding tranches. It is estimated that only 14 CLO 2.0 BBs/single Bs have been classified as defaulted or impaired by S&P out of over 12,000 originally rated 2.0 tranches.
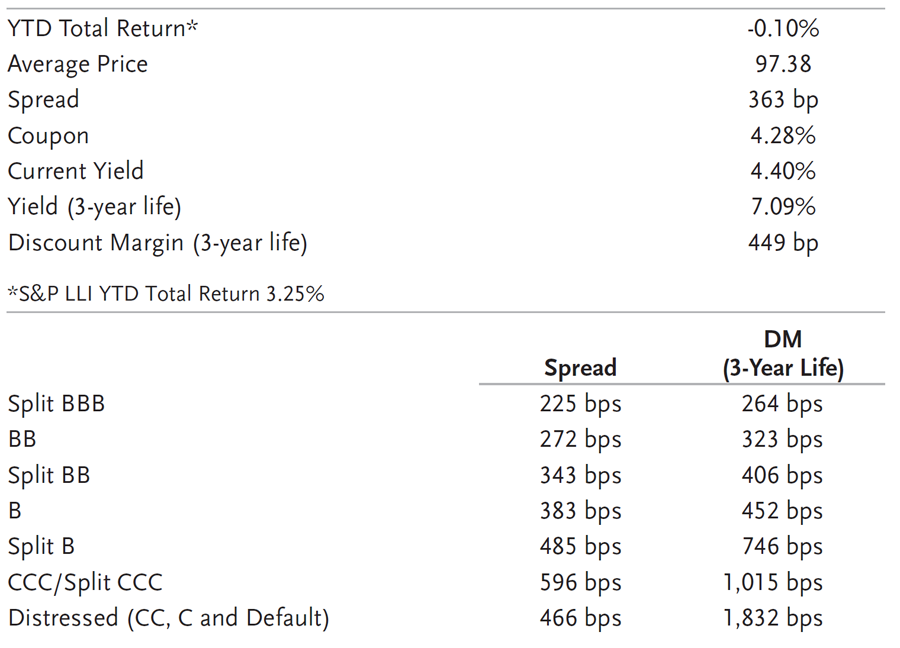
Valuation
Since 1992, the average 3-year discount margin (DM) for the CS LLI is 466 bps. If the global financial crisis (2008 and 2009) is excluded, the average 3-year Dm for the CS LLI is 427 bps. The 3-year DM finished the month at 449 bps, which was 1 bps tighter than the prior month.
The DM spread differential between double-Bs and single-Bs is 20 bps tighter from April 2021 to March 2022 and 61 bps tighter than the historical differential since inception.
3-Year Discount Margin Differential Between BBs and Single Bs
Source: Credit Suisse Leveraged Loan Index
CS LLI Snapshot
Source: Credit Suisse Leveraged Loan Index
Summary and Looking Forward
As we move into the second quarter, there are two items that jump out as unresolved questions. First, in regard to CLO manufacturing, secondary loan prices have rallied significantly in the last three weeks. While the primary continues to come at levels much wider than the secondary, it is not robust enough to ramp a CLO. So will triple-As and CLO liabilities continue to tighten enough to make the arbitrage work or have loans decoupled from the CLO market as the marginal buyer is now a retail loan fund? While retail loans have certainly contributed to the push in prices, it is hard to imagine that loans can move too far away from the CLO market given the current make-up of the market.
The second question that remains outstanding is in regard to the underlying fundamental performance of the collateral. The jump in LIBOR has resulted in an L+175 loan borrower paying nearly 20% more in interest than they did in the prior month. As a result of increasing cost of goods sold and increasing financing costs, we would expect many borrowers to have margins pressured in Q2 2022 and interest coverage should tighten.
TCW still sees significant room for base rates to increase before they pressure loan borrowers interest rate coverage and free-cash-flow profile. Having said that, one area it seems that markets may continue to underestimate is from borrowers that actually benefited from a COVID tailwind. Early results show several borrowers that had revenues boosted from COVID are now seeing a step function lower in revenues and EBITDA. Right now, as loans generally trade at higher levels, these post-COVID results are being dismissed.
Overall, the loans being manufactured today, benefit from tighter structures, lower prices and higher spreads. Managers that were able to “skate to where the puck will be” and open up warehouses in February and early March, will benefit from moving early. After all, the best of loans (and CLOs) are made in the worst of times.
Disclosure
Copyright © 2024 by S&P Global Market Intelligence, a division of S&P Global Inc. All rights reserved.
No content (including ratings, credit-related analyses and data, valuations, model, software or other application or output therefrom) or any part thereof (Content) may be modified, reverse engineered, reproduced or distributed in any form by any means, or stored in a database or retrieval system, without the prior written permission of S&P Global Market Intelligence or its affiliates (collectively, S&P). The Content shall not be used for any unlawful or unauthorized purposes. S&P and any third-party providers, as well as their directors, officers, shareholders, employees or agents (collectively S&P Parties) do not guarantee the accuracy, completeness, timeliness or availability of the Content. S&P Parties are not responsible for any errors or omissions (negligent or otherwise), regardless of the cause, for the results obtained from the use of the Content, or for the security or maintenance of any data input by the user. The Content is provided on an “as is” basis. S&P PARTIES DISCLAIM ANY AND ALL EXPRESS OR IMPLIED WARRANTIES, INCLUDING, BUT NOT LIMITED TO, ANY WARRANTIES OF MERCHANTABILITY OR FITNESS FOR A PARTICULAR PURPOSE OR USE, FREEDOM FROM BUGS, SOFTWARE ERRORS OR DEFECTS, THAT THE CONTENT’S FUNCTIONING WILL BE UNINTERRUPTED OR THAT THE CONTENT WILL OPERATE WITH ANY SOFTWARE OR HARDWARE CONFIGURATION. In no event shall S&P Parties be liable to any party for any direct, indirect, incidental, exemplary, compensatory, punitive, special or consequential damages, costs, expenses, legal fees, or losses (including, without limitation, lost income or lost profits and opportunity costs or losses caused by negligence) in connection with any use of the Content even if advised of the possibility of such damages.
Credit-related and other analyses, including ratings, and statements in the Content are statements of opinion as of the date they are expressed and not statements of fact. S&P Global Market Intelligence’s opinions, analyses and rating acknowledgment decisions (described below) are not recommendations to purchase, hold, or sell any securities or to make any investment decisions, and do not address the suitability of any security. S&P Global Market Intelligence assumes no obligation to update the Content following publication in any form or format. The Content should not be relied on and is not a substitute for the skill, judgment and experience of the user, its management, employees, advisors and/or clients when making investment and other business decisions. S&P Global Market Intelligence does not act as a fiduciary or an investment advisor except where registered as such. While S&P Global Market Intelligence has obtained information from sources it believes to be reliable, S&P Global Market Intelligence does not perform an audit and undertakes no duty of due diligence or independent verification of any information it receives.
S&P keeps certain activities of its business units separate from each other in order to preserve the independence and objectivity of their respective activities. As a result, certain business units of S&P may have information that is not available to other S&P business units. S&P has established policies and procedures to maintain the confidentiality of certain non-public information received in connection with each analytical process.
S&P may receive compensation for its ratings and certain analyses, normally from issuers or underwriters of securities or from obligors. S&P reserves the right to disseminate its opinions and analyses. S&P’s public ratings and analyses are made available on its Web sites, www.standardandpoors.com (free of charge), and www.ratingsdirect.com and www.globalcreditportal.com (subscription), and may be distributed through other means, including via S&P publications and third-party redistributors. Additional information about our ratings fees is available at www.standardandpoors.com/usratingsfees.
This material is for general information purposes only and does not constitute an offer to sell, or a solicitation of an offer to buy, any security. TCW, its officers, directors, employees or clients may have positions in securities or investments mentioned in this publication, which positions may change at any time, without notice. While the information and statistical data contained herein are based on sources believed to be reliable, we do not represent that it is accurate and should not be relied on as such or be the basis for an investment decision. The information contained herein may include preliminary information and/or "forward-looking statements." Due to numerous factors, actual events may differ substantially from those presented. TCW assumes no duty to update any forward-looking statements or opinions in this document. Any opinions expressed herein are current only as of the time made and are subject to change without notice. Past performance is no guarantee of future results. © 2024 TCW