

Episodic Volatility Is Here Again
Historians are on the edge of their seats as a war breaks out in Europe for the first time since Kosovo in 1998/1999 (excluding Crimea). Prior to the Russian invasion, the markets were already on edge with Treasuries sinking, inflation soaring and supply chains broken. In fact, when war broke out in Europe, one could not help but think of the Weimar Republic and the decade preceding World War II.
Episodic volatility is here again and while history does not always repeat itself it does often rhyme. In fact, those who have operated in the market for decades have seen geopolitical and major economic events create this kind of volatility.
First, in 2001, loans produced a negative return in the third quarter following the 9/11 attacks. The Credit Suisse Index was down roughly -87 basis points (bps) during the quarter and prices dropped approximately 2.5 points during the month. The index produced less than a 2% return during the next 12 months.
In 2003, when the Iraq War launched and oil remained remarkably stable, we saw the loan market produce its third best annual return since its inception (11%).
Outside of geopolitical events, we obviously witnessed the global financial crisis in 2008, European sovereign debt crises in 2011, taper tantrum in 2013, depressed oil prices in 2015, the trade war with China in Q4 2018, the pandemic in 2020 and now the Russian invasion of Ukraine. Each produced a different impact for loans but all, save the global financial crisis, seemed relatively easy for loans to shake off the impact.
Since the turn of the century (88 quarters), loans have only produced 14 negative quarterly returns.
On February 24, when Russia invaded Ukraine, the markets around the world began to react. Clearly, geopolitical events have had a limited impact on our market. Loan prices are down -98 bps since the invasion, which is a discount to the volatility experienced post 9/11.
Major Economic Events and Corresponding Loan Returns1
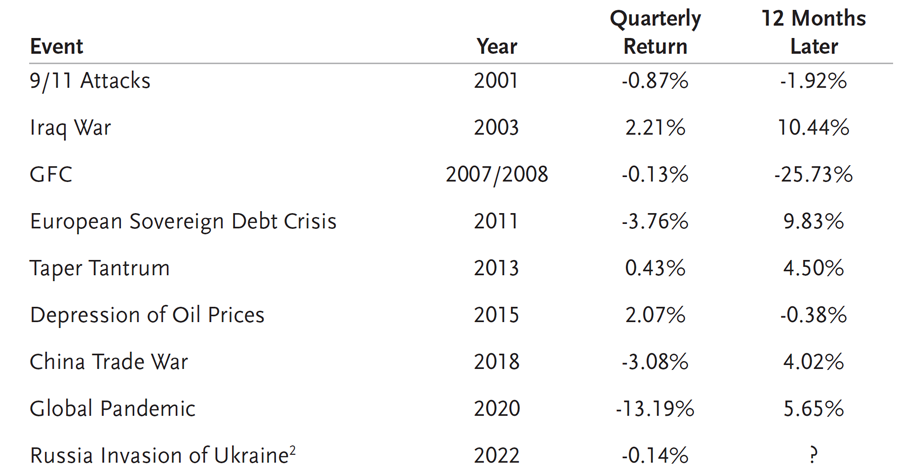
1 CS Index Returns provided in the table above.
2 YTD returns in lieu of quarterly returns.
Russia and Ukraine have a limited impact on the global economy and the loan market has a de minimis amount of first-order exposure to those two economies. However, in terms of a secondary effect, we would expect to see the next quarter or two impacted by the concomitant increase in oil and commodity prices. Transportation, chemicals, building products, semiconductors and food manufacturers will all face margin pressures.
The job of managers is to look through the volatility and see which sectors are trading at a discount to their intrinsic value and which sectors will rebound when the commodity inputs prove to be transitory.
Performance – Loans
In February, the Credit Suisse Leveraged Loan Index (CS LLI) and the S&P Leveraged Loan Index (S&P/LSTA) were down -0.50% and -0.51%, respectively.
On a year-to-date basis, the CS LLI is down -0.14% and the S&P/LSTA is down -0.15%.
For the 12 months ending February 28, the CS LLI was up 3.24% and the S&P/LSTA was up 3.20%.
In February, returns were pretty tightly clustered around the index return with distressed loans and split triple B outperforming. Generally, subsequent to the invasion, it seems as if higher spread/single Bs have outperformed while high quality/low spread have lagged. Triple Cs and distressed loans have underperformed and traded off the most.
On an LTM basis, triple Cs outperformed all categories with 7.53% return. Meanwhile, double B loans and single B loans produced 1.73% and 3.47% returns, respectively.
Total Return by Rating
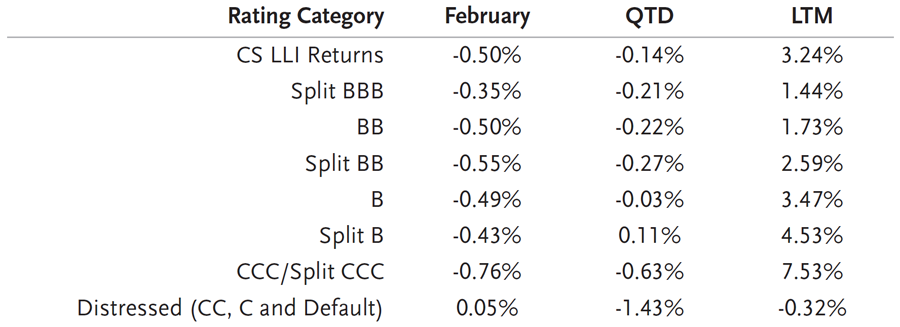
Source: Credit Suisse Leverage Loan Index
Sector Performance
In February, one sector in the CS LLI produced positive returns with the trend of tightening dispersion between the top and bottom sectors reversing. 157 bps separated the two, increasing from just 66 bps in the prior month. Metals/Minerals, Energy and Gaming/Leisure led all categories during the month with returns of 0.29%, -0.12%, and -0.13%, respectively. The bottom performing sectors were Media/Telecommunications, Retail, and Utility with total returns of -0.72%, -0.76%, and -1.28%, respectively.
In the last 12 months, Metals/Minerals, Energy, and Aerospace have led all sectors with total returns of 9.99%, 7.22%, and 4.32% while Media/Telecommunications, Food/Tobacco, and Utility provided the worst performing sector returns: 2.01%, 1.46%, and 0.10%.
Industry Returns
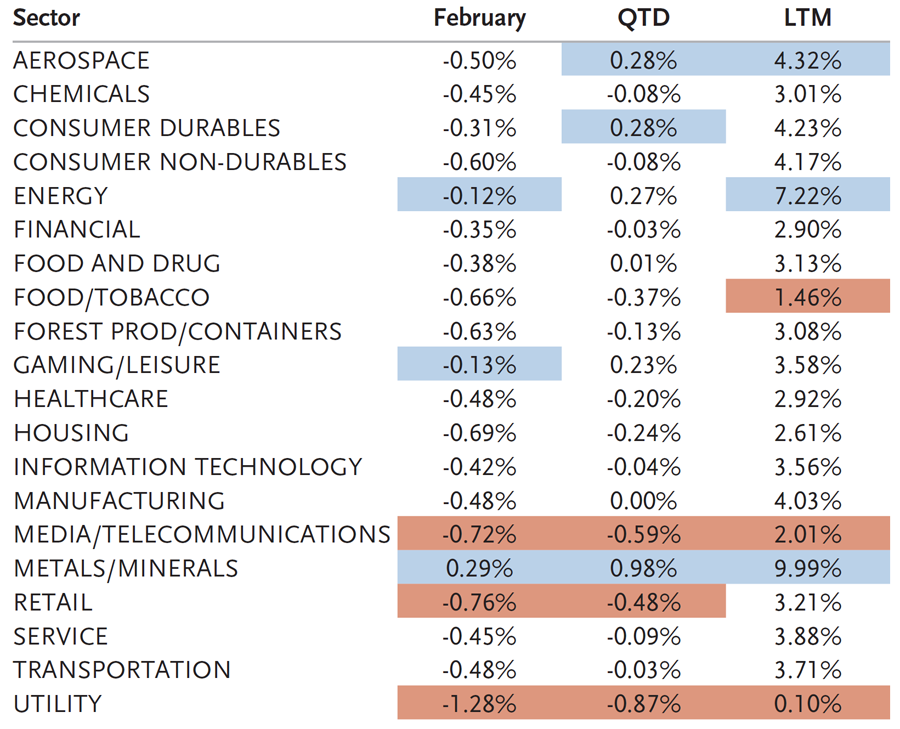
Source: Credit Suisse Leveraged Loan Index
The average bid of the S&P LCD flow-name loan composite decreased from 99.33 on February 3 to 98.53 by March 3. However, it is important to note that the weakness accelerated post February 24. During the same period the broader CS LLI decreased 86 bps. The secondary market activity has become more labored as there has been cross-over selling, almost no CLO activity at the end of the month and a slowing of inflows.
Average Loan Flow-Name Bid
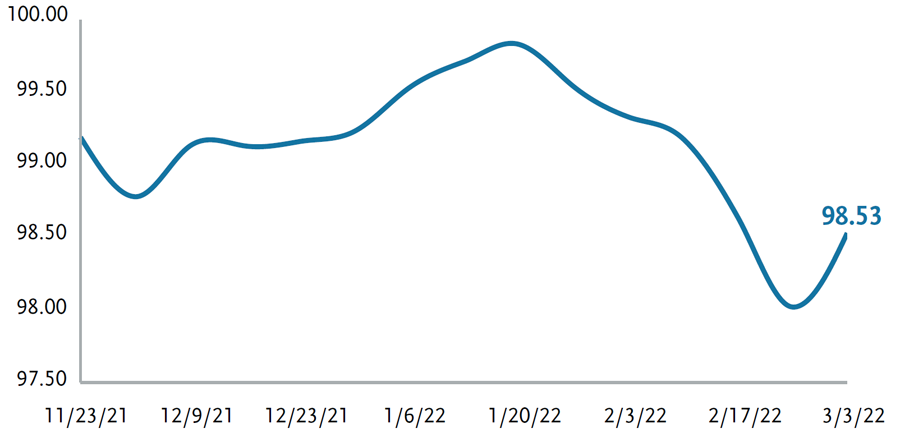
Source: Leveraged Commentary & Data (LCD)
Performance – CLOs
As in almost all other asset classes, CLO performance was negative for the month of February, with most of the underperformance in the second half of the month. In the first half, CLO secondary activity increased as investors looked to sell AAA CLOs to rotate into other asset classes that sold off more due to concerns on rising rates (e.g., fixed rate corps and securitized credit). CLO prices, due to their floating rate nature and technical support from the dealer community, held in well to start the month. However, as the month wore on and dealers started to get full, they showed increasing hesitancy to keep buying and CLO prices started to weaken. In addition, the macro volatility brought by Russia’s invasion of Ukraine further added to the spread widening. Yet even against this backdrop, CLOs still managed to broadly outperform other asset classes in February. CLOs returned -0.59% in Feb, with AAAs leading the decline at -0.46%, the lowest monthly return since March 2020 (-5%) and the fourth lowest monthly return since January 2013. CLOs outperformed IG Credit (-1.89%) and HY (-1.03%) and slightly underperformed Loans (-0.51%). On a YTD basis, CLOs are returning -0.24%, outperforming IG (-5%) and HY (-3.73%) and underperforming Loans (-0.15%).
Secondary CLO 2.0 Total Returns

Source: J.P. Morgan CLOIE Index
CLO AAA spreads widened 25 bps over the month as investors looked to sell the most liquid part of the capital stack in order to raise money to meet redemptions or to opportunistically rotate into other asset classes that experienced sharper negative price moves. As a result, AAA BWIC volume picked up to over $2.1 billion, a 30% increase from January. CLO prices were stable to start, as dealers absorbed most of the supply. However, by mid-month, dealers were less supportive and CLO AAAs took a turn for the worse with tier 1 AAA spreads going from 115 discount margin (DM) to 130 DM in a matter of days. Par dollar price AAAs to start the month, ended ½ point to 1 point lower by month end. Most of the trading was focused on tier 1 names as bids for tier 2 and 3 bonds were materially lower. Additionally, the term curve flattened with spreads on shorter duration AAAs trading at similar levels to 2021 vintage names as dollar price was more a focus vs. spread.
AA spreads also widened out from the mid 150s DM to 180s DM over the month. As with AAAs, AA trading was driven more by price than spread duration. Lower dollar priced AAs (97/$98h) traded tighter on a spread basis to higher dollar priced AAs ($99h). Tier 1 AAs mostly cleared in the mid 170s DM by month end, with lower tier bonds 10-20 bps wider. Single As traded in similar fashion to AAs with spreads 30 bps wider month-over-month and tier 1 bonds in the mid 200s DM by the end of the month.
BBB spreads held in well relative to the rest of the stack as they remained in sticky hands with investors reluctant to sell and if anything, eager to buy at lower levels. BBB investors have become increasingly more buy-and-hold as the tranche has an attractive coupon and is viewed as credit risk remote with an IG rating. Tier 1 BBBs widened from the low 300s to the mid 300s over the course of the month based on limited trade prints.
BB activity was muted with very little trading going through. Like BBBs, BB investors were reluctant to sell into the volatility with more axed to buy at wider spreads. BB BWIC volume declined by over 45% from January with spreads wider by 50 bps on tier 1 names.
Equity trading also took a breather as investors held back amongst the loan volatility towards the end of the month. BWIC volumes declined 30% as loan prices fell over 80 cents and equity NAVs declined 8 points. Longer reinvest, clean equity from tier 1 managers was down ~2-3 points from early February with dealers getting more client interest at lower levels.
Secondary trading activity increased meaningfully over the month with activity concentrated in AAAs. BWIC volume increased to over $4 billion and TRACE volume totaled $16.5 billion. For the aforementioned reasons above, IG TRACE volume increased by over 30% from Jan to $13 billion, the highest monthly IG volume since June 2020. However, non-IG volume declined by 35% to $3.2 billion.
Secondary CLO 2.0 Spreads (DM to 3 Month LIBOR)
Source: TCW
Technical Conditions – Loans
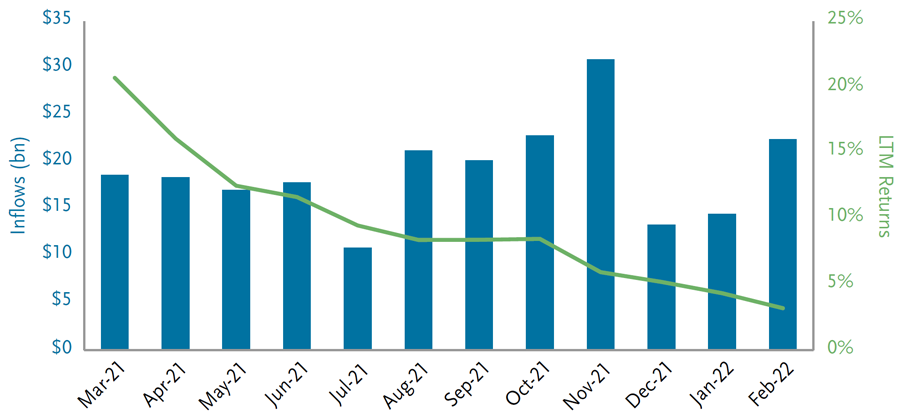
February inflows remained strong as investors looked for safety from interest-rate duration. Leveraged loan funds reported inflows totaling nearly $9 billion for the second consecutive month. Retail funds have reported inflows in 56 of the past 59 weeks. AUM for the loan mutual fund base is now $135 billion versus $69 billion at YE20 and $154 billion in Oct 2018. Interestingly, the first two months of 2022 have represented one of the few periods in recent history that inflows from retail funds equaled CLO issuance.
With CLO manufacturing running at a fraction of last year and cross-over sellers emerging in March, the question becomes – can retail inflows alone create price stabilization in the asset class?
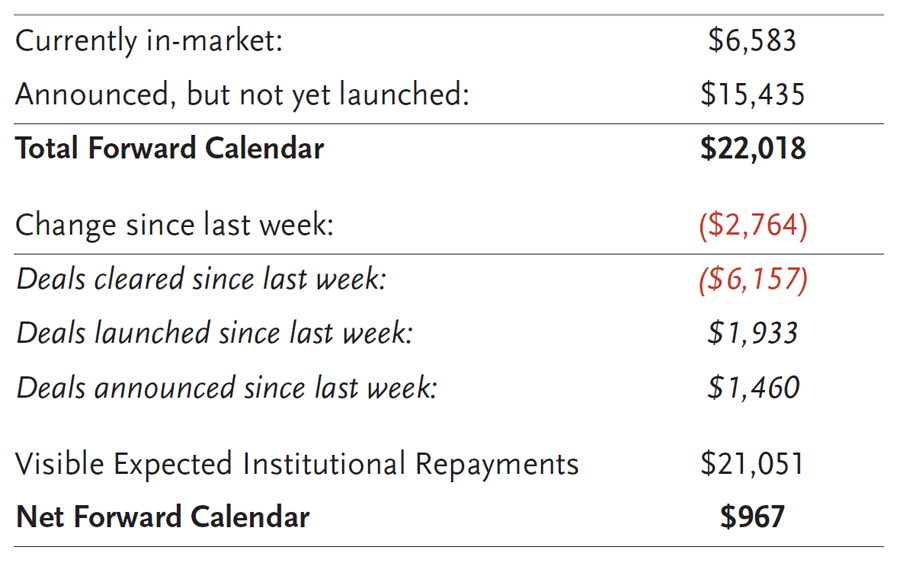
Offsetting a somewhat weak demand picture is supply. Supply in 2022 remains very subdued with the forward calendar at less than $1.0 billion. YTD, it has not weighed on the loan market.
Summary Institutional Loan Data ($ in millions)
Source: Credit Suisse Distribution
LTM returns have dropped to just 3.2% after reaching a high of 20% in March 2021. In the chart below, LTM returns first flattened as the average price in the index approached par and then began to decline with loan prices declining in February.
Inflows vs. Returns
Source: LCD, an offering of S&P Global Market Intelligence
Technical Conditions – CLO Primary
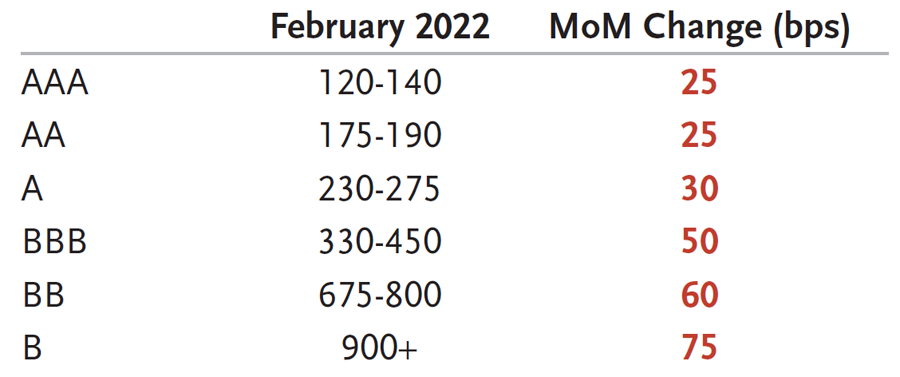
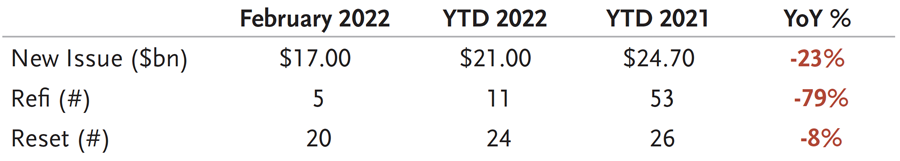
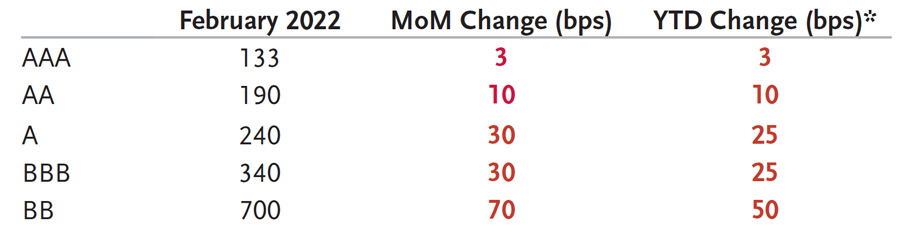
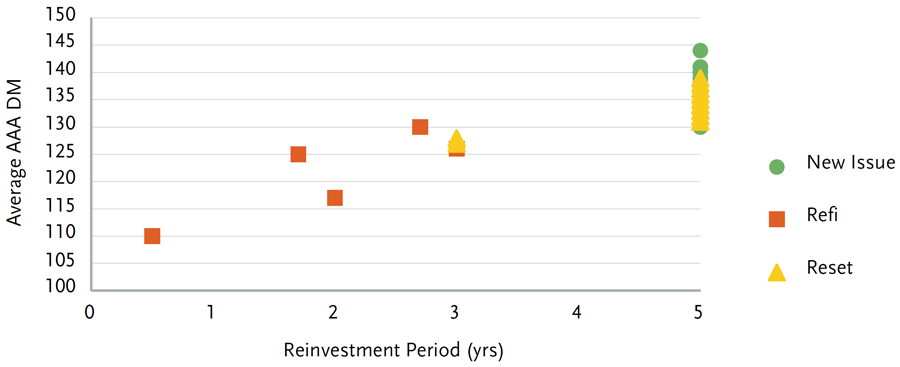
Issuance picked up significantly in the CLO primary market during February with $15.5 billion in new issue volume, more than tripling January numbers and marking the highest monthly total since November 2021. YTD, new issuance by the end of February totaled $21 billion, down 23% year over year. Issuance was robust during the first few weeks but then slowed toward the end of the month with geopolitical tensions and macro volatility at the forefront of investors’ minds. As a result, many deals were pulled or postponed from pricing. While the market reached a consensus on spreads at the beginning of the month, we again entered price discovery mode for new issue deals at the end of February. February spreads closed out the month wider across the stack with tier 1, 5-year reinvest AAAs landing at +133 bps, AAs at +190 bps, As at +240 bps, BBBs at +340 bps, and BBs at +700 bps. The AAA term curve still appears to be relatively flat with 3-year reinvest AAAs pricing in the low 130s DM at the end of February.
Refi/reset volumes were heavy through the month with five refis and 20 resets pricing, bringing YTD issuance to $4.3 billion for refis and $12.3 billion for resets. Refi/resets over the month continued to be predominantly 2019 vintage deals that have recently exited their call-protected periods.
We saw a notable pickup in middle market issuance during February with four deals pricing and totaling $2.3 billion. AAA spreads for 4 year reinvest middle market deals are sitting in the mid-160s DM for top tier deals, with the last middle market deal pricing in mid-February.
Going forward, managers will have to get creative in order to bring new issue deals given the better value most investors see in secondary. Wider liabilities have also decreased the arbitrage and as a result, we should see limited issuance in the near term and shorter reinvestment period deals that can price at tighter levels.
CLO New Issuance
Source: TCW
Tier 1 New Issue Spreads (5nc2)
Source: TCW
*Assuming 15 bps LIBOR/SOFR basis
New Issue BSL AAA DM – February 2022
Source: TCW
Lagging 12-Month Default Rates
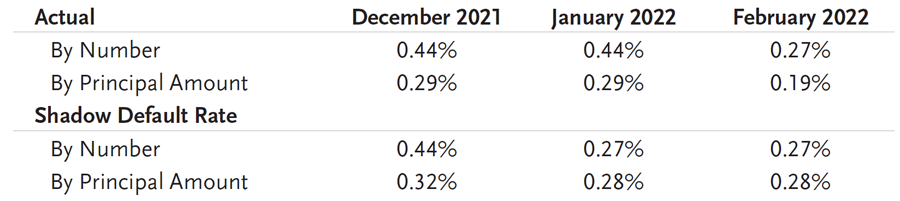
*Shadow default rate includes potential defaults, including those companies that have engaged
bankruptcy advisors, performing loans with SD or D corporate rating and those paying default interest.
Source: LCD, an offering of S&P Global Market Intelligence
There were no defaults in January or February and only three in the last 12 months. There has been one default each in Information Technology, Telecom, Oil & Gas. However, the rate of distressed companies has increased and if the impacts of the Russian invasion do not subside quickly then we would expect to see these numbers began to increase again.
The default rate of the S&P/LSTA, by issuer count, declined to 0.27% from 0.44% while the default rate based on par outstanding declined to 0.19% from 0.29%.
Fundamentals – CLOs
CLO credit metrics were mostly unchanged month over month while market value metrics deteriorated due to weakness in the loan market. WARF levels decreased by 24 bps over the month to 2,774. The percentage of defaulted assets remains at zero and we saw CCC/Caa exposure decline from 3.9% to 3.6%, bringing junior OC cushions to 440 bps from 430 bps in January. Lower loan prices caused equity NAVs to drop 8.5 points month-over-month to 59.6% and BB MVOCs were also softer. The percentage of loans trading above par decreased drastically over the month and is now <1%. The percentage of B-rated loans in CLO portfolios continues to increase, bringing the average to historical highs of 27%. We continue to watch B- exposure closely, as these loans have a higher likelihood of downgrade or default and have the potential to increase CCC buckets in the event of downgrades.
Valuation
Since 1992, the average 3-year discount margin (DM) for the CS LLI is 466 bps. If the global financial crisis (2008 and 2009) is excluded, the 3-year discount margin for the CS LLI is 427 bps. The 3-year DM finished the month at 450 bps, which was 18 bps wider than the prior month.
The DM spread differential between Double Bs and Single Bs is 23 bps tighter from March 2021 to February 2022 and 60 bps tighter than the historical differential since inception.
3-Year Discount Margin Differential Between BBs and Single Bs
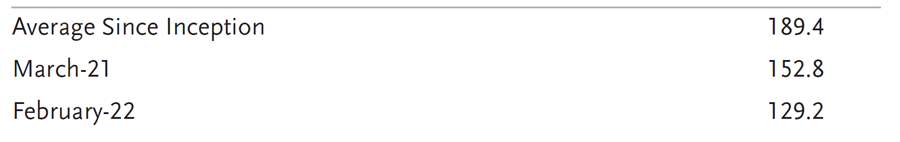
Source: Credit Suisse Leveraged Loan Index
CS LLI Snapshot
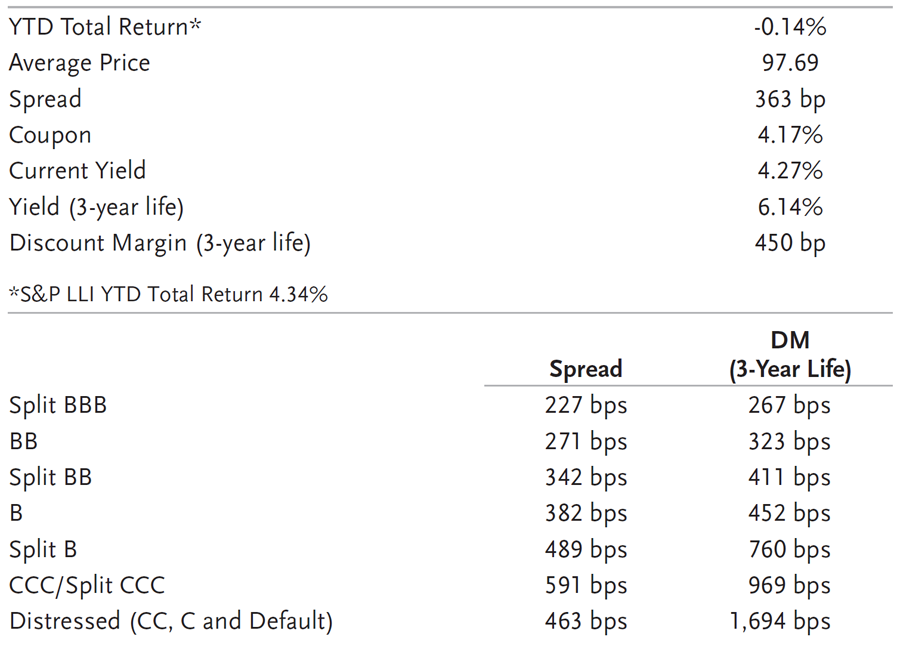
Source: Credit Suisse Leveraged Loan Index
Summary and Looking Forward
The technical characteristics of the loan market have become quite interesting at the end of February and beginning of March. CLO prints have become scarce as volatility in the investment grade market spilled into the CLO liabilities. As triple As widened at the end of February, we saw new issuance slow materially. With new CLOs not printing and existing CLOs fully invested, demand from this buyer base has been limited. Crossover bond funds have looked to sell high dollar priced loans to meet redemptions and to re-allocate into their core products, which have declined dramatically in dollar price. Retail loan inflows continue to be strong; however, with the Russian invasion continuing slowly and impacting headline news negatively on a daily basis, we have some concerns that flows will remain robust.
Consequently, the loan market is relying heavily on 10% of the market (retail loan funds) to provide an adequate amount of demand to meet supply. Having said that, weaker secondary prices have made new issuance very difficult and companies that can postpone issuance are doing so.
Further, one of the benefits of CLOs funds is that they do not experience outflows. Excluding crossover sellers, we have not seen another natural seller emerge.
As we move further into March, the war in Ukraine is weighing on global markets and this has also weighed on loans and CLOs. We began this monthly review by trying to put geopolitical and macroeconomic events in perspective. It is important to realize that these episodic bouts of volatility have a beginning and an end. We are three weeks into the world digesting the Russian aggression and commodities have been heavily impacted. Until we see some stabilization in these prices and loan borrowers have had the ability to pass on higher costs, we expect to see continued volatility in the markets. We also expect to see the spike in oil and wheat prices roll through borrower margins for the next one or two quarters… or until we see stabilization in these commodities…
Disclosure
Copyright © 2024 by S&P Global Market Intelligence, a division of S&P Global Inc. All rights reserved.
No content (including ratings, credit-related analyses and data, valuations, model, software or other application or output therefrom) or any part thereof (Content) may be modified, reverse engineered, reproduced or distributed in any form by any means, or stored in a database or retrieval system, without the prior written permission of S&P Global Market Intelligence or its affiliates (collectively, S&P). The Content shall not be used for any unlawful or unauthorized purposes. S&P and any third-party providers, as well as their directors, officers, shareholders, employees or agents (collectively S&P Parties) do not guarantee the accuracy, completeness, timeliness or availability of the Content. S&P Parties are not responsible for any errors or omissions (negligent or otherwise), regardless of the cause, for the results obtained from the use of the Content, or for the security or maintenance of any data input by the user. The Content is provided on an “as is” basis. S&P PARTIES DISCLAIM ANY AND ALL EXPRESS OR IMPLIED WARRANTIES, INCLUDING, BUT NOT LIMITED TO, ANY WARRANTIES OF MERCHANTABILITY OR FITNESS FOR A PARTICULAR PURPOSE OR USE, FREEDOM FROM BUGS, SOFTWARE ERRORS OR DEFECTS, THAT THE CONTENT’S FUNCTIONING WILL BE UNINTERRUPTED OR THAT THE CONTENT WILL OPERATE WITH ANY SOFTWARE OR HARDWARE CONFIGURATION. In no event shall S&P Parties be liable to any party for any direct, indirect, incidental, exemplary, compensatory, punitive, special or consequential damages, costs, expenses, legal fees, or losses (including, without limitation, lost income or lost profits and opportunity costs or losses caused by negligence) in connection with any use of the Content even if advised of the possibility of such damages.
Credit-related and other analyses, including ratings, and statements in the Content are statements of opinion as of the date they are expressed and not statements of fact. S&P Global Market Intelligence’s opinions, analyses and rating acknowledgment decisions (described below) are not recommendations to purchase, hold, or sell any securities or to make any investment decisions, and do not address the suitability of any security. S&P Global Market Intelligence assumes no obligation to update the Content following publication in any form or format. The Content should not be relied on and is not a substitute for the skill, judgment and experience of the user, its management, employees, advisors and/or clients when making investment and other business decisions. S&P Global Market Intelligence does not act as a fiduciary or an investment advisor except where registered as such. While S&P Global Market Intelligence has obtained information from sources it believes to be reliable, S&P Global Market Intelligence does not perform an audit and undertakes no duty of due diligence or independent verification of any information it receives.
S&P keeps certain activities of its business units separate from each other in order to preserve the independence and objectivity of their respective activities. As a result, certain business units of S&P may have information that is not available to other S&P business units. S&P has established policies and procedures to maintain the confidentiality of certain non-public information received in connection with each analytical process.
S&P may receive compensation for its ratings and certain analyses, normally from issuers or underwriters of securities or from obligors. S&P reserves the right to disseminate its opinions and analyses. S&P’s public ratings and analyses are made available on its Web sites, www.standardandpoors.com (free of charge), and www.ratingsdirect.com and www.globalcreditportal.com (subscription), and may be distributed through other means, including via S&P publications and third-party redistributors. Additional information about our ratings fees is available at www.standardandpoors.com/usratingsfees.
This material is for general information purposes only and does not constitute an offer to sell, or a solicitation of an offer to buy, any security. TCW, its officers, directors, employees or clients may have positions in securities or investments mentioned in this publication, which positions may change at any time, without notice. While the information and statistical data contained herein are based on sources believed to be reliable, we do not represent that it is accurate and should not be relied on as such or be the basis for an investment decision. The information contained herein may include preliminary information and/or "forward-looking statements." Due to numerous factors, actual events may differ substantially from those presented. TCW assumes no duty to update any forward-looking statements or opinions in this document. Any opinions expressed herein are current only as of the time made and are subject to change without notice. Past performance is no guarantee of future results. © 2024 TCW