

Despite Positive Backdrop Expect Sporadic Volatility
Mont St. Michel is a small island with a walled city that sits off the coast of Normandy, France. Each day the water recedes and a path is created from the mainland to the small city. Then each night, the water comes back and leaves Mont St. Michel a protected island again.
In January, interest rate activity has taken center stage. Each day, the fixed income markets get battered by rate concerns and just as this volatility threatens to spill into the loan market, the concerns get drowned by inflows. Inflows from retail funds and separately managed accounts left investors flush with cash, thus insulating loan assets from the price volatility seen in high yield and other fixed income markets.
Retail loans represent a small percentage of the overall market; however, with less overall supply generated by the “street,” the retail inflows have been able to push secondary loan prices higher during the month.
Primary Market by Investor Type
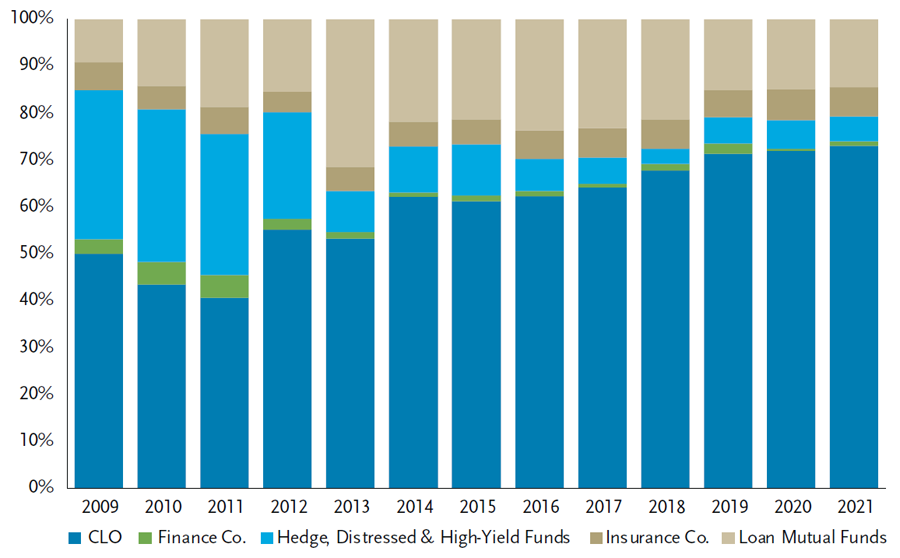
Source: S&P LCD’s Quarterly Leveraged Lending Review, 4Q 2021
New issue CLOs have had a slow start to the year with under $5.0 billion printed in January. As a result, most of the secondary volumes were driven by retail loan investors. However, because so many CLOs are still in the ramp process (a.k.a. warehousing), primary deals are consistently oversubscribed by a multiple of the deal size.
Furthermore, in conversations with most investment banks the expectations for M&A supply for the first quarter are pretty limited. Loan supply in January was mitigated by a number of CLOs called, as equity investors liquidated vehicles at prices, which were close to all-time highs. The higher prices of the loan collateral and the CLO liability transition from LIBOR to SOFR has created a slightly worse CLO arbitrage to start the year.
Performance – Loans
In January, the Credit Suisse Leveraged Loan Index (CS LLI) and the S&P Leveraged Loan Index (S&P/LSTA) were both up 0.36%. For the 12 months ending January 31, the CS LLI was up 4.45% and the S&P/LSTA was up 4.34%.
In January, single Bs outperformed double Bs. In the first three weeks of the month, risk generally outperformed. However, prices remediated during the last ten days of the month and weakness was most pronounced in lower coupon/higher quality loans as well as lower quality segments of the market. Consequently, we saw distressed loans trade lower while triple Cs also lagged higher quality loans.
On an LTM basis, triple Cs outperformed all categories with 10.63% return. Meanwhile, double B loans and single B loans produced 2.54% and 4.55% returns, respectively.
Total Return by Rating
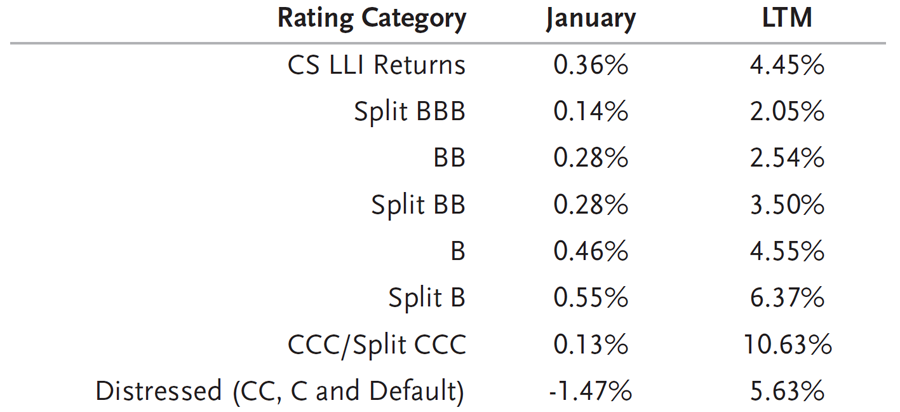
Source: Credit Suisse Leverage Loan Index
Sector Performance
In January, all 20 sectors in the CS LLI produced positive returns with the dispersion continuing to tighten between the top and bottom sectors. Only 66 basis points (bps) separated the two. Aerospace, Metals/Minerals and Consumer Durables led all categories during the month with returns of 0.78%, 0.69% and 0.59%, respectively. The bottom performing sectors were Healthcare, Retail and Media/Telecommunications with total returns of 0.28%, 0.28% and 0.12%, respectively.
In the last 12 months, Metals/Minerals, Energy and Consumer Non-Durable have led all sectors with total returns of 10.39%, 10.34% and 6.06% while Media/Telecommunications, Food/Tobacco and Utility provided the worst performing sector returns: 3.31%, 2.52% and 1.26%.
Industry Returns
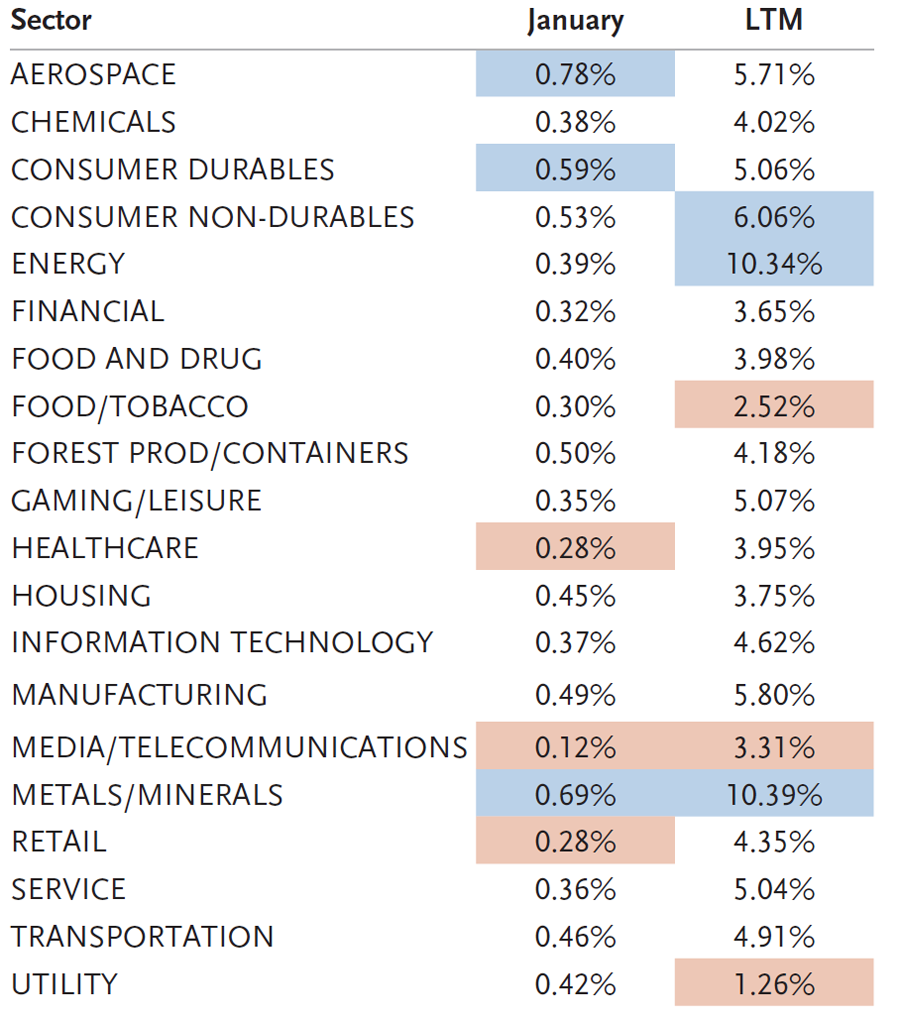
Source: Credit Suisse Leveraged Loan Index
The average bid of the S&P LCD flow-name loan composite increased from 99.23 at the end of 2021 to 99.33 by February 3. During the same period the broader CS LLI increased 17 bps. However, it is important to note that the CS LLI hit an average price high on January 20 and then experienced some weakness as crossover sellers began selling loans in the last ten days of the month. The secondary market activity was dominated by retail funds as January saw record inflows to the asset class.
Average Loan Flow-Name Bid
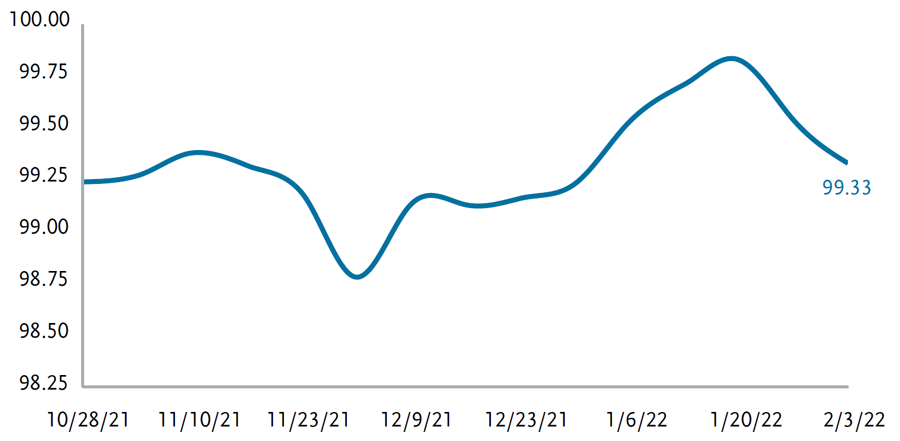
Source: Leveraged Commentary & Data (LCD)
Performance – CLOs
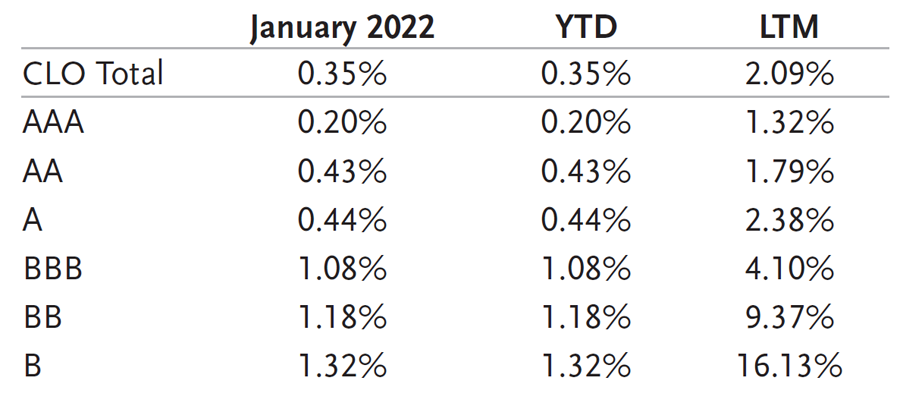
CLO performance was slightly positive in January as limited primary supply and demand for floating rate instruments outweighed overall macro weakness. The hawkish tone of the Federal Reserve (the Fed) created record inflows into loans that resulted in a rally in loan prices boosting CLO NAVs and MVOC ratios. As a result, CLOs and loans stood out as one of the few fixed income asset classes to generate positive returns over the month. CLOs overall returned +0.35% in January, flat to loan performance (+0.36%) and substantially outperforming IG credit (-3.21%) and HY (-2.73%). The majority of returns were generated at the bottom of the capital stack with BBBs and BBs returning 1.08% and 1.18% respectively due to their higher beta with loans.
Secondary CLO 2.0 Total Returns
Source: J.P. Morgan CLOIE Index
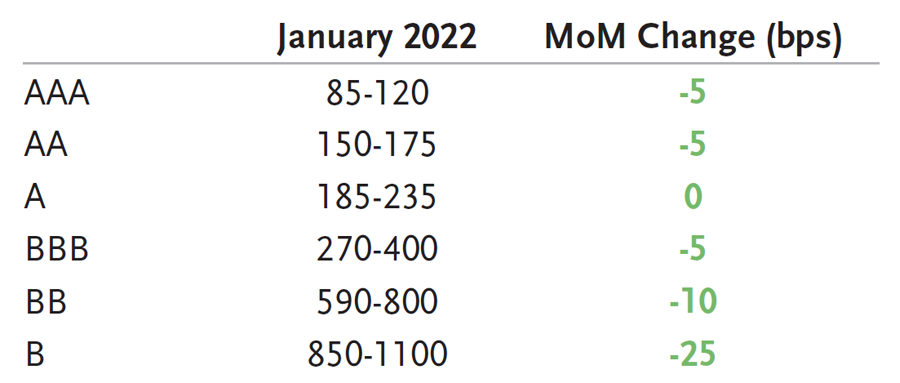
CLO AAA spreads were firm over the month due to lower primary supply. LIBOR to SOFR transition coupled with the large pull forward issuance in Q4 2021, caused January to be one of the lowest issuance months in recent years. As a result, investors looking to put CLO cash to work looked to the secondary market for supply. Given the demand, AAA BWIC volume increased to over $1.6 billion in January versus $1.2 billion in December. Dealers were also taken out of much of their inventory at the start of the month and ended net sellers of IG by $175 million. Spreads ended the month flat to slightly tighter with tier 1, longer duration AAAs at 110 discount margin (DM).
AA and single A spreads were also flat during the month with limited supply in secondary causing little to no spread movement. Tier 1 AA and single A spreads ended the month in the 150s and 190s DM respectively. BBB BWIC volume was average to slightly higher, but spreads remained rangebound to slightly tighter as loan prices improved MVOCs. Tier 1 BBBs traded mostly in the high 200s/low 300s DM.
BB volume picked up significantly over the month with over double the amount of BWIC activity from December. Record low default rates, reduced tail risk from a decline in CCC and lower priced assets coupled with higher MVOCs caused BB spreads to tighten in the first few weeks of the month. Toward the end of the month, BBs gave back some of their tightening with supply heavy and high yield spreads widening to levels not seen since November 2020. Additionally, tiering became more evident as lower tier, less sought after profiles traded wider. Trading got sloppier as the rate of DNTs picked up and spread dispersion increased. Tier 1, longer reinvest BBs ended the month in the low to mid 600s DM.
Secondary CLO 2.0 Spreads (DM to 3 Month LIBOR)
Source: TCW
Equity activity was elevated over the month with $550 million in equity BWIC activity. The rise in NAVs and quarterly payouts had many investors looking to sell and monetize their positions. Q1 cash-on-cash distributions were stable from Q4 2021, with the majority of distributions in the 3.5-4% range for reinvesting deals. Future payments are expected to be lower from rising LIBOR and potential SOFR/LIBOR mismatches, which was another catalyst for selling. By the end of the month, equity prices were down 2-4 points and the percentage of DNTs increased.
Overall secondary volume increased with BWIC volume at $4 billion and total TRACE volume at $14.9 billion ($9.9 billion IG/$5 billion non IG), a substantial pickup from December. Lack of primary supply coupled with increased demand for floating rate bonds and quarterly equity payments helped to support secondary supply and levels. As CLOs were one of the few asset classes to hold their value over the month, many investors looked to sell to either raise cash or rotate into assets that had sold off. Given the high volume, dealers were essentially flat over the month ($176 million lighter in IG and $170 million net longer in non IG), displaying the customer demand especially for IG CLOs.
Technical Conditions – Loans
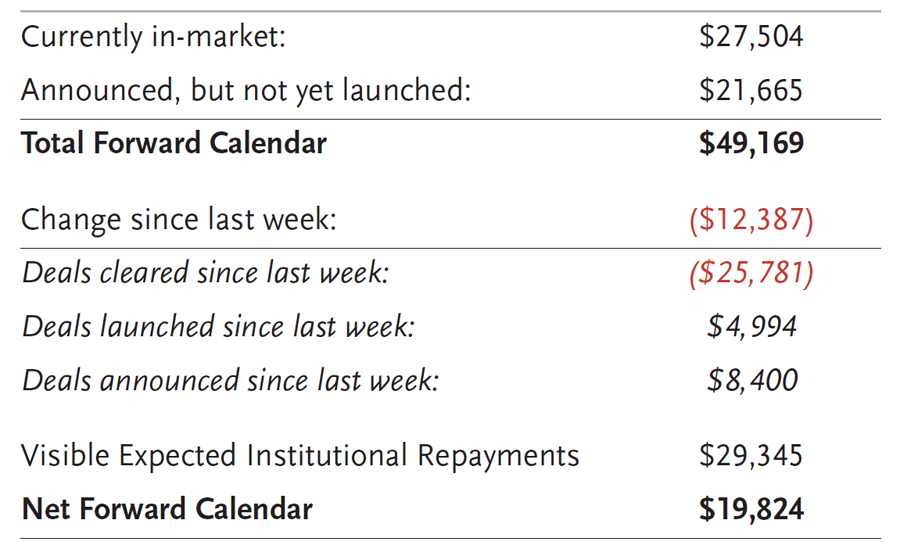
As 2022 begins, the net forward calendar increased materially from a very quiet December. There is $19.8 billion of visible net issuance; however, when talking to most sell-side firms their calendars for the first quarter seem to be pretty light. Without large visible supply, it leaves the loan market vulnerable to spikes in prices every time demand surges. Both loan issuance and CLO issuance are slow out of the gates as borrowers, lenders and investors all get more comfortable with SOFR-based deals, given the SOFR-LIBOR basis adjustment and the potential mismatch between the collateral and the liabilities.
Summary Institutional Loan Data ($ in millions)
Source: Credit Suisse Distribution
Leveraged loan funds reported $9.8 billion of inflows in January with the loan asset class reporting only three outflows in the last 55 weeks. AUM for loan funds is now over $125 billion as compared to $69 billion at year-end 2020 and to the peak assets under management mark of $154 billion set in October 2018. Inflows for loan funds totaled $46.5 billion in 2021 and have been on record pace YTD.
LTM returns now represent a return close to the all-in coupon of loans. In the chart below, LTM returns have begun to flatten as the average price in the index approaches par.
Inflows vs. Returns
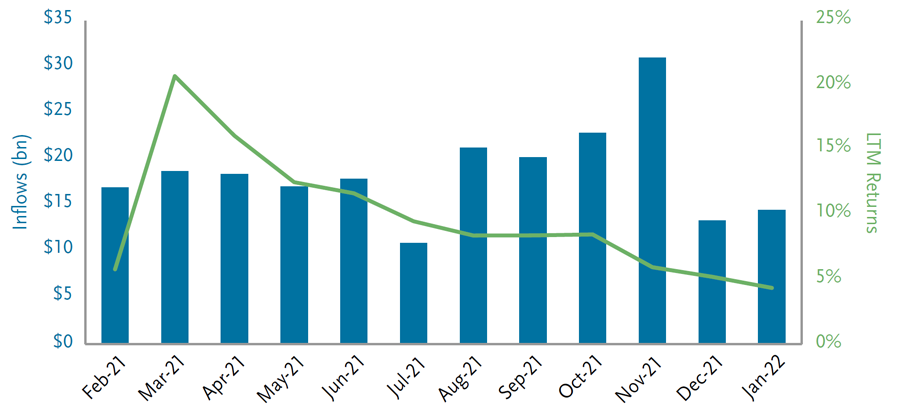
Source: LCD, an offering of S&P Global Market Intelligence
Technical Conditions – CLO Primary
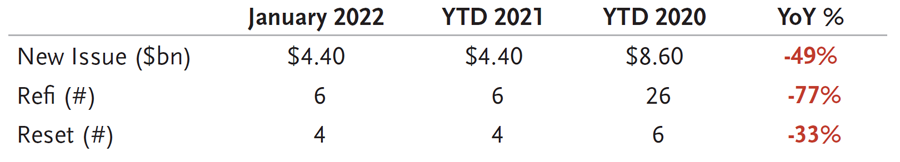
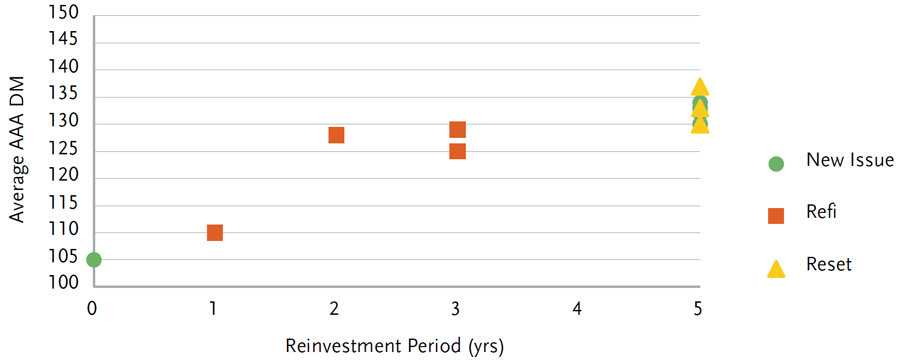
The CLO market had a slow start to the year with only $4.4 billion in new issue volume, across eight deals in January, the lowest monthly issuance since 2017 and almost 50% lower than January 2021. While January issuance has been historically lower than average, reduced volumes this January can be attributed to the CLO market’s transition to SOFR at the beginning of this year and the substantial amount of pull forward issuance in November 2021 as managers rushed to price LIBOR-based deals. The market spent much of January patiently awaiting price discovery for CLOs benchmarked to SOFR. SOFR-based AAA levels held firm when considering the 15 bps spread adjustment from LIBOR while mezz levels have been pricing flat to LIBOR with no basis. January ended with tier 1 5-year reinvest AAAs landing at 130 bps, AAs at 180 bps, As at 210 bps, BBBs at 310 bps, and BBs at 630 bps. The AAA term curve flattened considerably through January with 5-year reinvest AAAs pricing at 129-134 DM, 3-year reinvest AAAs pricing at 128-129 DM, and static AAAs pricing at 105-110 DM over the month. The curve at the end of January was, however, based on limited new issue volumes and is expected to steepen as primary issuance picks up.
Refi/reset volumes were also relatively light with six refis totaling $2.2 billion and four resets totaling $2 billion pricing over the month. The majority of refi/resets in January were 2019- and 2020-vintages as the deals were exiting their call-protected periods.
We also saw the first middle market deal benchmarked to SOFR price in January bringing middle market issuance to $350 million in 2022. The static deal’s AAA priced at SOFR +137. The market is still awaiting price discovery on spreads on full duration 4-year reinvest 2-year non-call middle market CLOs.
CLO New Issuance
Source: TCW
Tier 1 New Issue Spreads (5nc2)
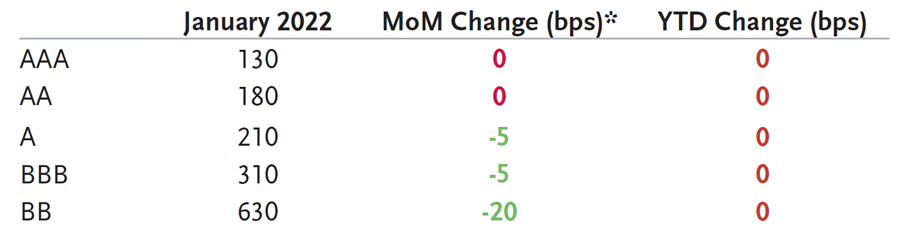
Source: TCW
*Assuming 15 bps LIBOR/SOFR basis
New Issue BSL AAA (DM to 3 Month SOFR) – January 2022
Source: TCW
Lagging 12-Month Default Rates
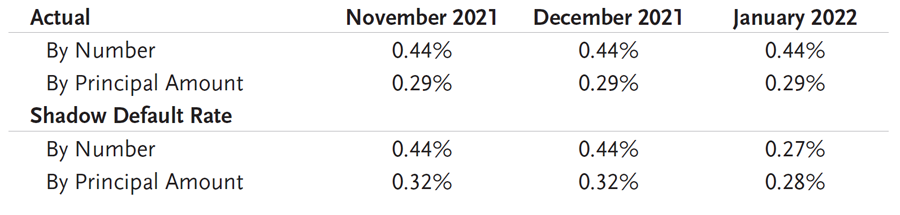
*Shadow default rate includes potential defaults, including those companies that have engaged
bankruptcy advisors, performing loans with SD or D corporate rating and those paying default interest.
Source: LCD, an offering of S&P Global Market Intelligence
There were no defaults in January and only five in the last 12 months. There has been one default each in Information Technology, Telecom, Oil & Gas, Textile & Apparel and Retail.
The default rate of the S&P/LSTA, by issuer count, remained flat at 0.44% while the default rate based on par outstanding was also constant at 0.29%.
Fundamentals – CLOs
CLO fundamentals were mostly flat to slightly improved in January. WARF levels were unchanged ending the month at 2,790. The percentage of defaulted assets remained at zero and CCC/Caa exposure was flat month over month. Junior OC cushions remained at 430 bps, and value metrics incrementally improved with equity NAVs up 1.5 points to 68.1 and BB MVOCs flat at 107. The percentage of distressed assets declined with the rally in loan prices which is also a prognosticator of a lower go-forward default environment. On the flip side, the percentage of B- rated loans in CLOs continues to increase with a historically high average exposure of 26%. Given B- rated issuers have a higher probability for downgrade or default, this is a trend we are closely watching.
Valuation
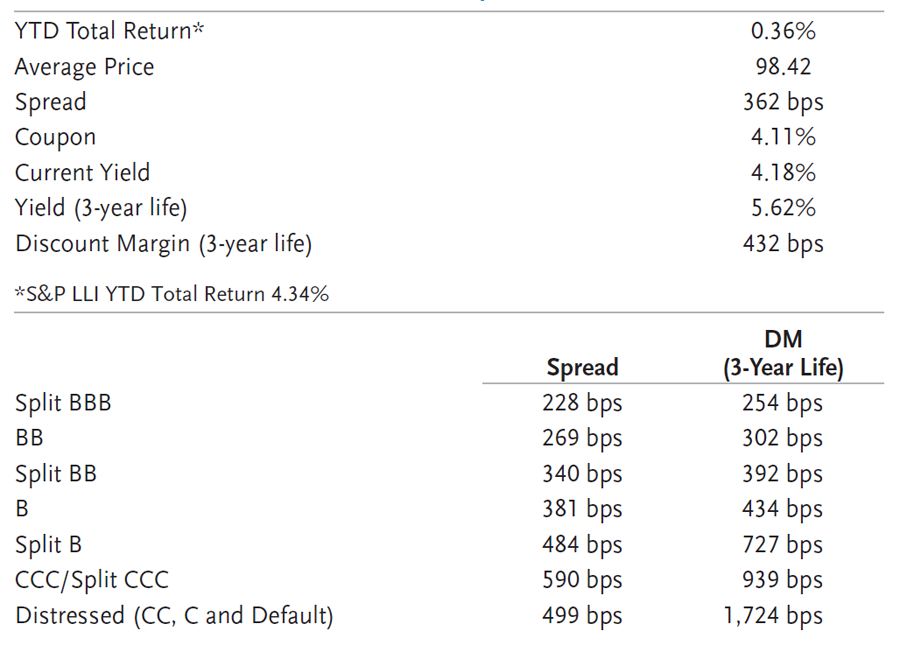
Since 1992, the average 3-year DM for the CS LLI is 466 bps. If the global financial crisis (2008 and 2009) is excluded, the 3-year discount margin for the CS LLI is 427 bps. The 3-year DM finished the month at 432 bps, which was 7 bps tighter than the prior month.
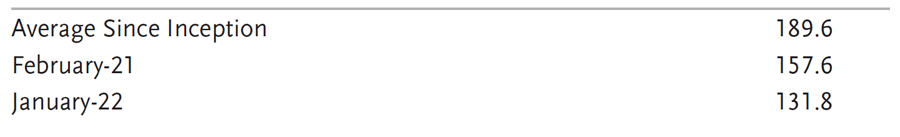
The DM spread differential between Double Bs and Single Bs is 26 bps tighter from February 2021 to January 2022 and 58 bps tighter than the historical differential since inception.
3-Year Discount Margin Differential Between BBs and Single Bs
Source: Credit Suisse Leveraged Loan Index
CS LLI Snapshot
Source: Credit Suisse Leveraged Loan Index
Summary and Looking Forward
Loan secondary prices were supported by record retail inflows and while the CLO machine was slow to print deals during the month of January, the large supply of warehouses on the sideline led to considerable support of primary issuance. These supply-demand characteristics have created a unique environment where primary deals were oversubscribed by 1-2x of deals size even when secondary loan prices began weakening. With light leveraged loan supply on deck for the remainder of the quarter and record retail inflows, the supply picture seems generally supportive of rising loan prices in the near to intermediate term. The most logical disruption will come from crossover sellers, liquidating/called CLOs and a slower CLO calendar than anticipated. We anticipate coupon-like returns with bouts of volatility.
Given the Federal Reserve’s unwind from pumping cash into the system, we would expect to see an increase in volatility across the fixed income and equity market. This volatility will consistently impact the arbitrage of the CLO market.
Floating rate loan assets will generally benefit from the higher rate interest environment, meaning retail funds should continue to outpace other asset classes in terms of inflows. Despite a positive backdrop for loans, we would also expect to see the broader market volatility sporadically spill into the loan prices, creating buying opportunities. The timing of CLO prints will be critical in 2022. Attractive arbitrage returns – at least at the outset of the deal will vary greatly depending on what week rampers are ramping. Loan prices hit the highest levels since 2014 on January 20 and by the end of the month were 40 bps lower. The variance during this short period of time was material to start 2022 and we would expect this condition to remain true for the entire year.
Disclosure
Copyright © 2024 by S&P Global Market Intelligence, a division of S&P Global Inc. All rights reserved.
No content (including ratings, credit-related analyses and data, valuations, model, software or other application or output therefrom) or any part thereof (Content) may be modified, reverse engineered, reproduced or distributed in any form by any means, or stored in a database or retrieval system, without the prior written permission of S&P Global Market Intelligence or its affiliates (collectively, S&P). The Content shall not be used for any unlawful or unauthorized purposes. S&P and any third-party providers, as well as their directors, officers, shareholders, employees or agents (collectively S&P Parties) do not guarantee the accuracy, completeness, timeliness or availability of the Content. S&P Parties are not responsible for any errors or omissions (negligent or otherwise), regardless of the cause, for the results obtained from the use of the Content, or for the security or maintenance of any data input by the user. The Content is provided on an “as is” basis. S&P PARTIES DISCLAIM ANY AND ALL EXPRESS OR IMPLIED WARRANTIES, INCLUDING, BUT NOT LIMITED TO, ANY WARRANTIES OF MERCHANTABILITY OR FITNESS FOR A PARTICULAR PURPOSE OR USE, FREEDOM FROM BUGS, SOFTWARE ERRORS OR DEFECTS, THAT THE CONTENT’S FUNCTIONING WILL BE UNINTERRUPTED OR THAT THE CONTENT WILL OPERATE WITH ANY SOFTWARE OR HARDWARE CONFIGURATION. In no event shall S&P Parties be liable to any party for any direct, indirect, incidental, exemplary, compensatory, punitive, special or consequential damages, costs, expenses, legal fees, or losses (including, without limitation, lost income or lost profits and opportunity costs or losses caused by negligence) in connection with any use of the Content even if advised of the possibility of such damages.
Credit-related and other analyses, including ratings, and statements in the Content are statements of opinion as of the date they are expressed and not statements of fact. S&P Global Market Intelligence’s opinions, analyses and rating acknowledgment decisions (described below) are not recommendations to purchase, hold, or sell any securities or to make any investment decisions, and do not address the suitability of any security. S&P Global Market Intelligence assumes no obligation to update the Content following publication in any form or format. The Content should not be relied on and is not a substitute for the skill, judgment and experience of the user, its management, employees, advisors and/or clients when making investment and other business decisions. S&P Global Market Intelligence does not act as a fiduciary or an investment advisor except where registered as such. While S&P Global Market Intelligence has obtained information from sources it believes to be reliable, S&P Global Market Intelligence does not perform an audit and undertakes no duty of due diligence or independent verification of any information it receives.
S&P keeps certain activities of its business units separate from each other in order to preserve the independence and objectivity of their respective activities. As a result, certain business units of S&P may have information that is not available to other S&P business units. S&P has established policies and procedures to maintain the confidentiality of certain non-public information received in connection with each analytical process.
S&P may receive compensation for its ratings and certain analyses, normally from issuers or underwriters of securities or from obligors. S&P reserves the right to disseminate its opinions and analyses. S&P’s public ratings and analyses are made available on its Web sites, www.standardandpoors.com (free of charge), and www.ratingsdirect.com and www.globalcreditportal.com (subscription), and may be distributed through other means, including via S&P publications and third-party redistributors. Additional information about our ratings fees is available at www.standardandpoors.com/usratingsfees.
This material is for general information purposes only and does not constitute an offer to sell, or a solicitation of an offer to buy, any security. TCW, its officers, directors, employees or clients may have positions in securities or investments mentioned in this publication, which positions may change at any time, without notice. While the information and statistical data contained herein are based on sources believed to be reliable, we do not represent that it is accurate and should not be relied on as such or be the basis for an investment decision. The information contained herein may include preliminary information and/or "forward-looking statements." Due to numerous factors, actual events may differ substantially from those presented. TCW assumes no duty to update any forward-looking statements or opinions in this document. Any opinions expressed herein are current only as of the time made and are subject to change without notice. Past performance is no guarantee of future results. © 2024 TCW