

Record Issuance of Loans, CLOs in 2021
Sometimes you have to stop and appreciate the magnitude of the moment. November produced the most prolific monthly CLO issuance in the history of the market with $26 billion priced. Annual issuance for the CLO market is also reaching a record level with $174 billion priced YTD as compared to the previous annual high of $129 billion for U.S. volumes.
U.S. CLO Issuance
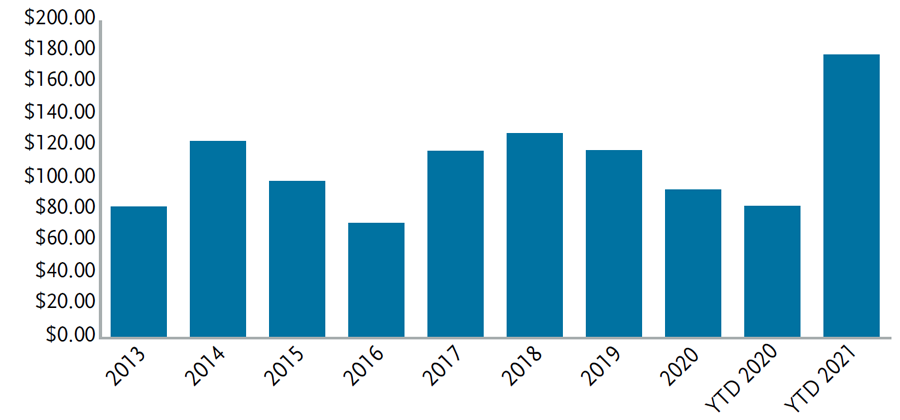
Source: S&P CLO Historical Stats
With one month remaining in 2021, there has been $600 billion of institutional loans syndicated YTD. That amount dwarfs any previous annual total.
Annual Institutional Loan Issuance
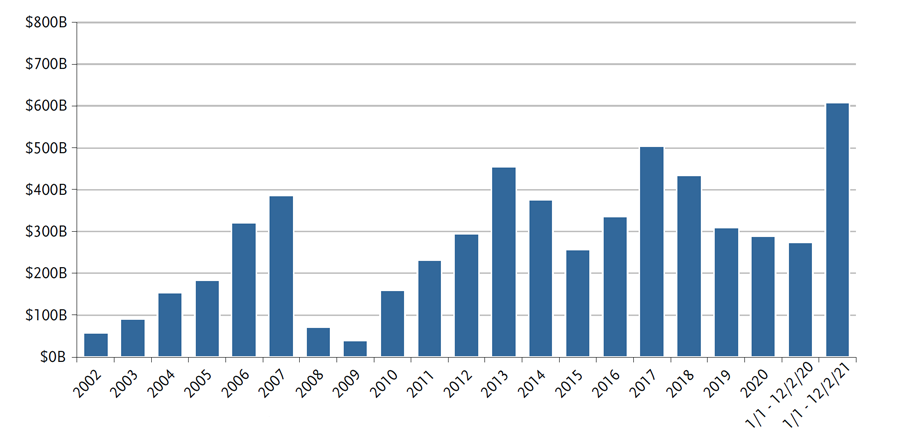
Source: S&P Global Market Intelligence
During a heavy supply and demand period in November, the loan market produced its worst monthly returns of the year. In part this was caused by a technical condition where loan managers were just “full” and had little cash to buy new issue without being forced to sell assets. However, the rise of the Omicron variant created a pull back for risk markets broadly. That pull back led to some cross-over selling as well as outflows in retail loan accounts. Finally, we also saw many loan borrowers report third quarter earnings in November. While most results were good, we saw many borrowers impacted by inflation and supply chain logistics. Input prices (including labor) for some borrowers rose at the fastest rate in their history and many of these borrowers were either unable to pass the costs on or are experiencing a lag in pricing in the higher costs. This final inflationary factor feels like it will take several quarters for borrowers to fully resolve.
Overall, while there was broad based weakness in the loan market, volatility was manageable. With a seemingly limitless supply of CLO warehouse dollars, demand always seems to be poised on the sideline, ready to step-in if there is more pronounced weakness.
Performance – Loans
In November, the Credit Suisse Leveraged Loan Index (CS LLI) was down -0.15% and the S&P Leveraged Loan Index (S&P/ LSTA) was down -0.16%. YTD returns for the CS LLI and S&P/LSTA are positive 4.74% and 4.53%, respectively. For the 12 months ending November 30, the CS LLI was up 6.10% and the S&P/LSTA was up 5.94%.
In November, risk generally underperformed as triple Cs and distressed loans were the worst performing segments of the market. Split triple Bs modestly outperformed double Bs, which outperformed split BBs. Conversely, on a year-to-date basis, triple Cs and distressed loans outperformed all categories with 13.90% and 12.97% return, respectively. Meanwhile, double B loans and single B loans produced 2.35% and 4.44% returns.
On an LTM basis, risk outperformed as triple Cs led all categories with a 16.36% return. Single Bs produced a 5.79% return and double Bs returned 3.44%.
Total Return by Rating
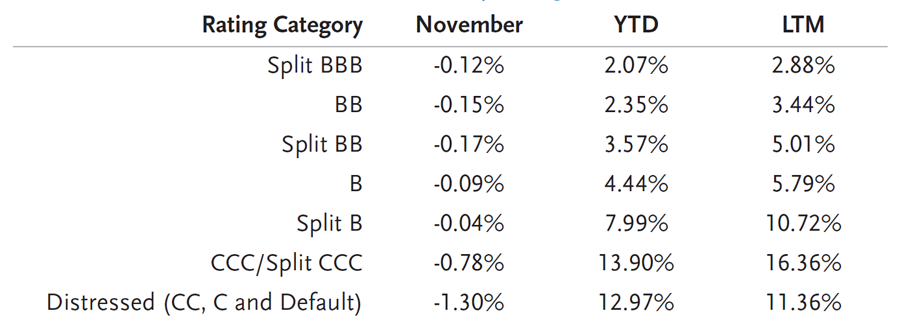
Source: Credit Suisse Leverage Loan Index
Sector Performance
In November, seven sectors in the CS LLI produced positive returns with none above 16 basis points (bps). Dispersion essentially remained flat between the top performing sector and the bottom performing sector with 98 bps separating the two. Metals/Minerals, Energy and Manufacturing led all categories. The bottom performing sectors were Consumer Durables, Utility and Aerospace with total returns of -0.38%, -0.59% and -0.81%, respectively.
In the last 12 months, Energy, Metals/Minerals and Consumer Non-durable have led all sectors with total returns of 17.16%, 15.25% and 9.18%, respectively. Financial, Food/Tobacco and Utility provided the worst performing sector returns: 4.48%, 4.08% and 2.03%, respectively.
Industry Returns
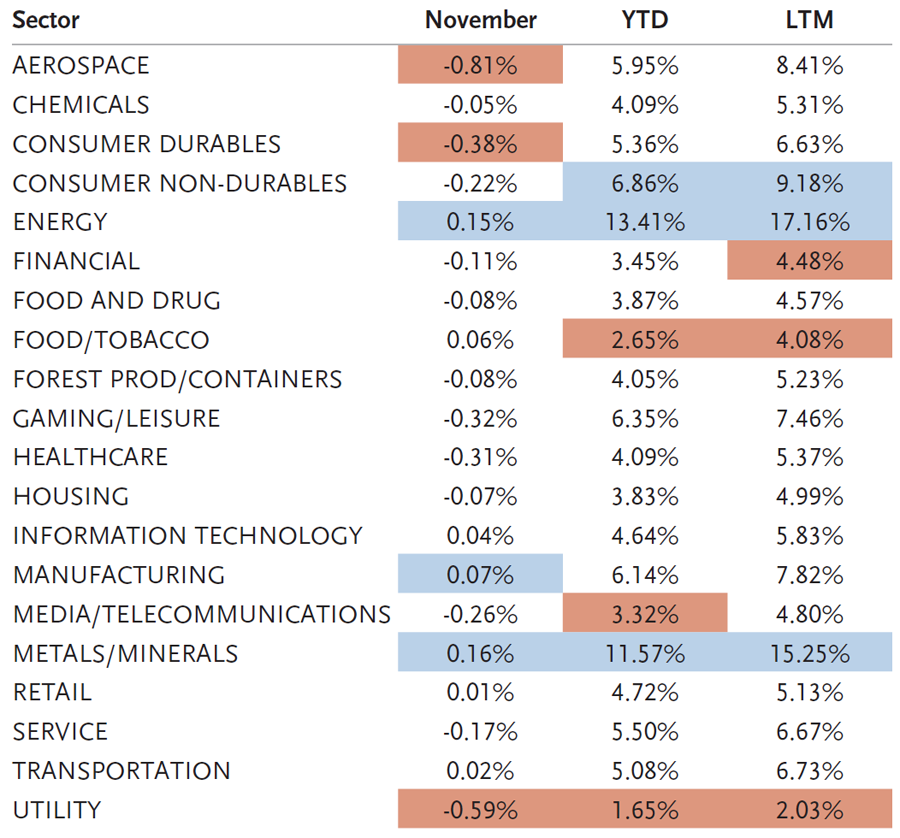
Source: Credit Suisse Leveraged Loan Index
The average bid of the S&P LCD flow-name loan composite decreased from 99.27 on November 4 to 98.78 on December 2. During the same period the broader CS LLI decreased -45 bps. The magnitude of issuance in the loan market weighed on the broader market. In November, over $60 billion of new loans printed and there has been $182 billion of institutional new issuance during the last three months. Despite record CLO issuance and a huge warehouse pipeline, the loan primary left most managers with virtually no cash.
Average Loan Flow-Name Bid
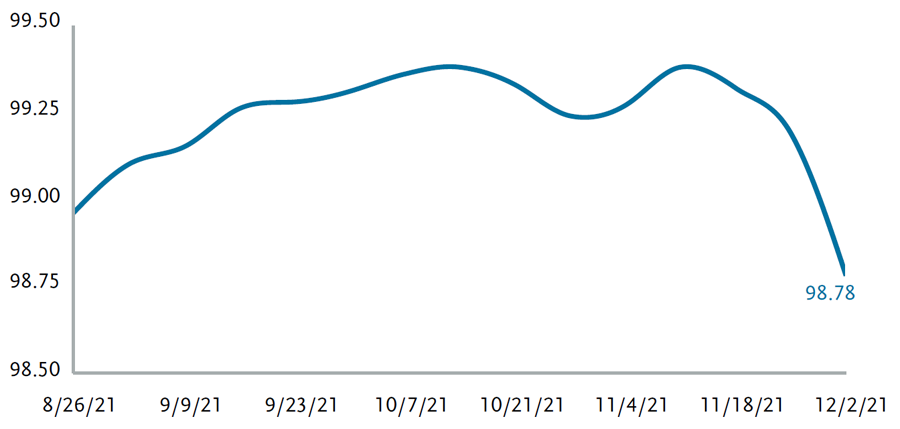
Source: Leveraged Commentary & Data (LCD)
Performance – CLOs
Heavy supply in primary and secondary combined with elevated macro volatility due to the discovery of a new Covid variant caused CLO spreads to slightly weaken over the month. CLOs still managed to eke out positive returns of 2 bps, mainly due to coupon return slightly outpacing price declines. On a relative basis, CLOs marginally underperformed IG credit (+0.8%) and outperformed Leveraged Loans (-0.16%) and HY (-0.97%) with High Yield clocking in its worst monthly performance in over a year. On a YTD basis, CLOs are returning +2.27%, outperforming IG credit (+-1.0%) and underperforming HY (+3.34%) and Leveraged Loans (+4.53%).
AAA spreads weakened by 5-10 bps over the month, largely in part due to heavy supply in primary and secondary. November primary issuance broke records with over $24 billion in new issuance. In addition, secondary AAA BWIC volume was over $2.1 billion, a 40% increase from October, driven in large part from an $830 million bid list. Buyers were wary of adding risk this late in the year and dealers were keen to shed balance sheet vs. add positions going into year end. As a result, secondary AAA prices declined 10-15 cents with many bonds trading below par, something the market hasn’t seen in many months. Longer duration, Tier 1 spreads moved from 110 DM to 115 DM with shorter duration trading close to par for those bonds that are out of reinvestment.
AA spreads also widened due to similar reasons, heavy supply and lower demand. AA BWIC volume increased to $500 million over the month, a 66% increase from October’s $300 million. Tier 1, full duration spreads widened from 150 Discount Margin to 160-165 DM, in line with new issuance levels with many trading at a discount to par. Single A spreads held in better, mainly because there was not much supply in that tranche.
BBB and BB spreads widened 30-50 bps on the back of renewed credit concerns from Covid-related names and lower MVOCs. Median BB MVOCs dropped 30 bps over the month as loans sold off. More seasoned deals with higher CCC exposure widened the most as CCC rated loans underperformed dramatically. In addition, heavy primary supply also weighed in on spreads with new issue BBB and BB levels 5-10 bps wider over the month.
Secondary equity levels remained firm to slightly weaker as NAVs took a 2-3 point hit from the decline in loan prices. BWIC volume was flat month over month but the rate of DNTs did pick up. Buyers were trying to be opportunistic and “buy the dip” but equity holders did not have the desire to sell at lower levels. The default rate forecast over the next 6-12 months looks to be low and along with robust cash on cash payments and recent loan volatility, equity still looks attractive to many investors.
Overall BWIC volume increased to $4.2 billion vs. $3.7 billion in October. This was led largely in part from an increase in AAA BWICs which totaled over $2 billion. However, total trading activity declined to $10.5 billion due a decline in non-IG activity. Dealers ended up longer by $350 million over the month.
Secondary CLO 2.0 Total Returns
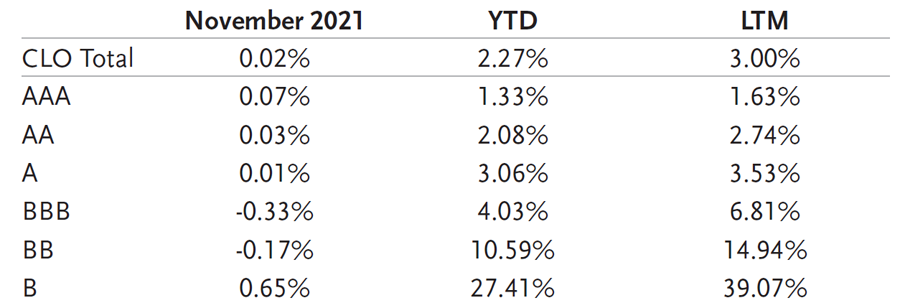
Source: J.P. Morgan CLOIE Index
Secondary CLO 2.0 Spreads (DM)
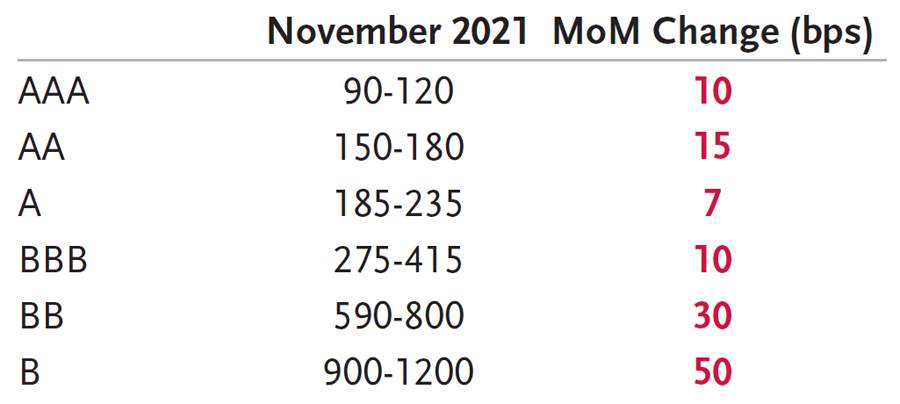
Source: TCW
Technical Conditions – CLO Primary
CLO primary issuance exceeded expectations yet again in November by printing a record-breaking $25.6 billion in new issue across 52 deals, setting an all-time new issuance record for the second month in a row. One of the main factors of increased issuance is the upcoming LIBOR to SOFR transition in 2022 that pushed CLO managers to price and close a LIBOR-based deal prior to year-end. Given that most loans are still LIBOR based, CLO managers were incentivized to price LIBOR-based deals to avoid basis risk with the SOFR transition next year. Since most deals take four to six weeks between pricing and closing, November was really the last month where managers could price and close a deal in 2021. YTD issuance reached a whopping $174 billion in November.
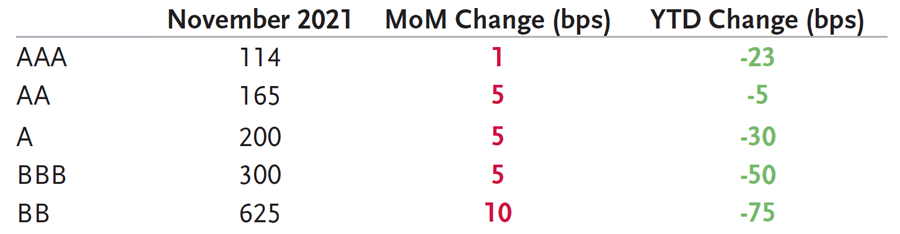
Refi/reset volumes were robust over the month as well with $6 billion in refi volume and $12 billion in reset volume pricing over the month. Heavy new issue volume and overall market volatility caused spreads to widen across the stack with AAAs 1-2 bps wider and the rest of the stack 5-10 bps. Tier 1, full duration AAAs ended the month at 114 DM, AAs at 165 DM, As at 200 DM, BBBs at 300 DM, and BBs at 625 DM. Even with higher cost of funds, the arb remained attractive for CLOs with primary loans spreads remaining wide.
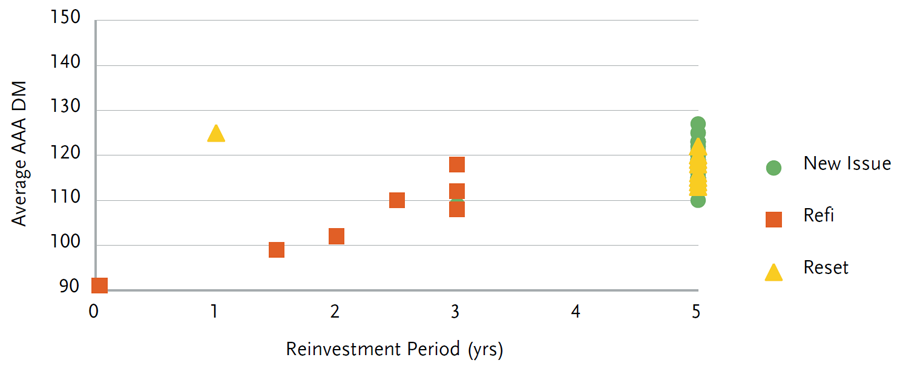
The AAA term curve has remained steep with shorter-dated refis pricing in the 90s DM and longer deals in the 112-120 DM. However, the term curve started to flatten into month end due to heavy supply with the middle of the curve (2 yr reinv) 5-10 bps wider. We also continued to see robust middle market issuance with six deals pricing over the month for a total of $4 billion in new issue. Demand for middle market deals remains high due to the wider spreads in addition to robust fundamentals. Middle market AAA spreads remained relatively flat over the month, ranging from 149-155 DM for 4 year reinvest 2 year non-call deals. YTD middle market issuance now stands at $17.6 billion.
Notably, the first new issue deal with a SOFR benchmark priced in November. The 5 year reinvest / 2 year non-call deal split its AA tranche into LIBOR- and SOFR-linked notes, with the LIBOR-linked tranche pricing at L + 190 and the SOFR-linked tranche pricing at SOFR + 210. The pricing suggests a 20bp spread adjustment for a 5-year reinvestment period, which is consistent with the 15bp spread adjustment for a 3-year reinvestment period reset that we saw on the first SOFR-based tranche in October.
CLO New Issuance
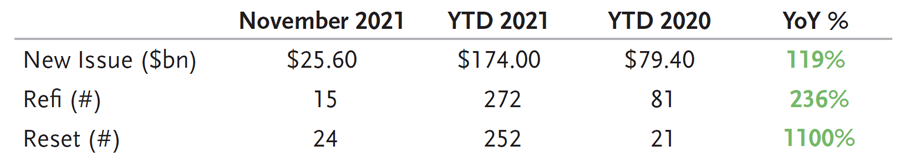
Source: TCW
Tier 1 New Issue Spreads (5nc2)
Source: TCW
New Issue BSL AAA DM – November 2021
Source: TCW
Technical Conditions – Loans
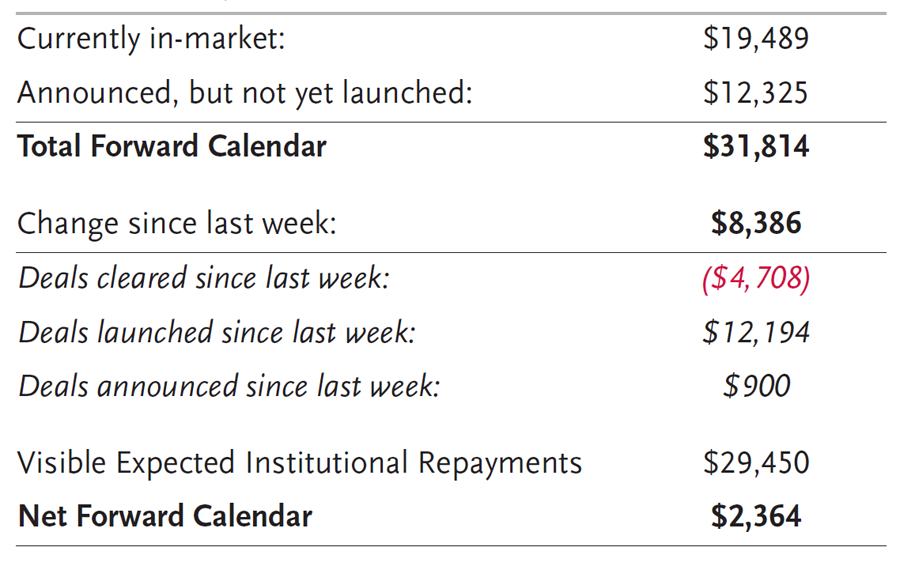
As November faded into the distance, the net forward calendar declined to $2 billion following a prolific three months of issuance. December has roughly 2.5 weeks of time when the primary is expected to remain active and then the market is expected to become very quiet through the New Year.
Summary Institutional Loan Data ($ in millions)
Source: Credit Suisse Distribution
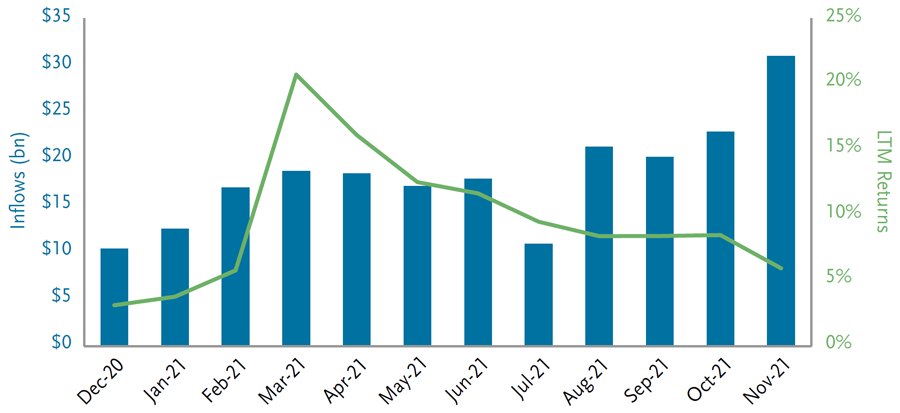
Leveraged loan funds reported $4.7 billion of inflows in November with the loan asset class reporting only two outflows in the last 46 weeks. AUM for loan funds is now over $114 billion as compared to $69 billion at year-end 2020 and to the peak assets under management mark of $154 billion set in October 2018. Inflows for loan funds totaled $42.7 billion YTD following outflows in 2020 totaling -$27.0 billion.
Returns post March 2020 have largely been retracing the pandemic losses in February and March of 2020. LTM returns have begun to flatten and approach coupon returns as the average price in the index approaches par.
Inflows vs. Returns
Source: LCD, an offering of S&P Global Market Intelligence
Fundamentals – Loans
Lagging 12-Month Default Rates
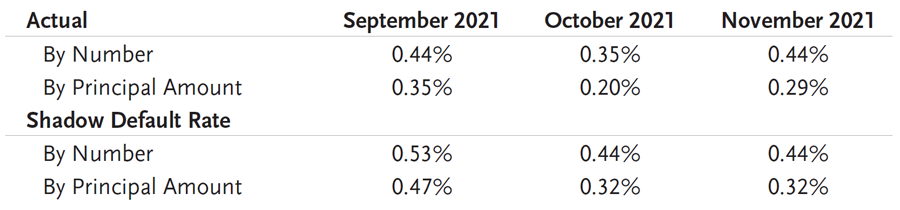
*Shadow default rate includes potential defaults, including those companies that have engaged
bankruptcy advisors, performing loans with SD or D corporate rating and those paying default interest.
Source: LCD, an offering of S&P Global Market Intelligence
There was one loan default in November and only five in all of 2021. There has been one default each in Information Technology, Telecom, Oil & Gas, Textile & Apparel and Retail.
The default rate of the S&P/LSTA, by issuer count, increased from 0.35% to 0.44% while the default rate based on par outstanding increased from 0.20% to 0.29%.
Fundamentals – CLOs
CLO fundamentals were mostly flat or improved month over month with WARF levels in the low 2800s and the percentage of defaulted assets remaining at zero. CCC/Caa exposure also declined another 10 bps over the month. Junior OC cushions continued to improve with the reduction in CCC/Caa assets, and are currently sitting at 400 bps. Value metrics deteriorated slightly over the month along with the softness in loan prices. Median equity NAVs were down 3 points to $64 and BB MVOCs down 30 bps.
Valuation
Since 1992, the average 3-year discount margin (DM) for the CS LLI is 466 bps. If the global financial crisis (2008 & 2009) is excluded, the 3-year discount margin for the CS LLI is 427 bps. The 3-year DM finished the month at 451 bps, which was 11 bps wider than the prior month.
The DM spread differential between Double Bs and Single Bs is 24 bps tighter from December 2020 to November 2021 and 50 bps tighter than the historical differential since inception.
3-Year Discount Margin Differential Between BBs and Single Bs
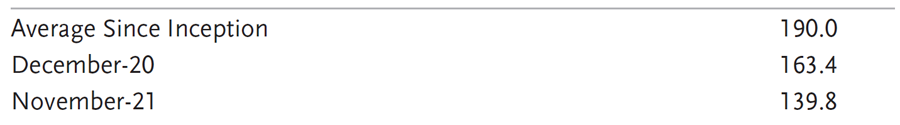
Source: Credit Suisse Leveraged Loan Index
CS LLI Snapshot
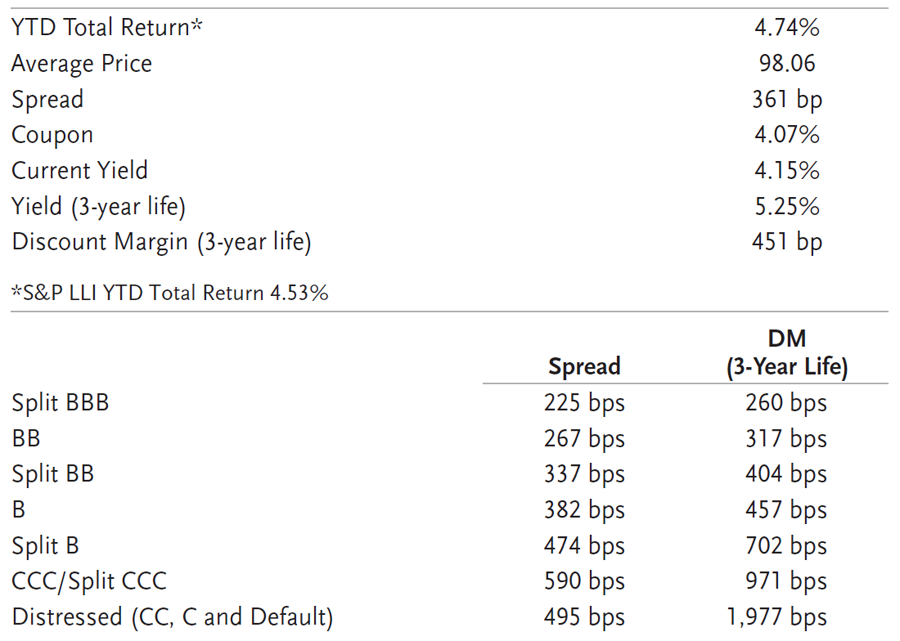
Source: Credit Suisse Leveraged Loan Index
Summary and Looking Forward
November and 2021 produced historic CLO and loan primary volumes. While the volumes were prolific, November also saw the most significant price weakness of the year. However, as we turn the page to the final month of the year, risk markets are again rebounding. There seems to be a clear pause in December CLO issuance as investors transition from LIBOR to SOFR. Loan issuance remains active in terms of number of deals, however, the total dollars has declined dramatically. Deals can be generally be characterized as smaller issuance and add-on term loans used for both acquisitions and dividends.
Clearly the $26 billion CLO print in November was enabled by pulling forward demand from future months as many investors wanted to keep exposure to LIBOR-based deals. With little borrower news for the remainder of the year and light overall issuance, loans are poised to grind higher barring a shift in macro sentiment. Typically, loan managers deal with many pay downs and amortization payments at the end of the year and these push cash levels higher. Finally, because of this technical and the fact January loan deals do not allocate until the end of the month or the beginning of February, we often see loan prices grind higher to start the year.
Disclosure
Copyright © 2025 by S&P Global Market Intelligence, a division of S&P Global Inc. All rights reserved.
No content (including ratings, credit-related analyses and data, valuations, model, software or other application or output therefrom) or any part thereof (Content) may be modified, reverse engineered, reproduced or distributed in any form by any means, or stored in a database or retrieval system, without the prior written permission of S&P Global Market Intelligence or its affiliates (collectively, S&P). The Content shall not be used for any unlawful or unauthorized purposes. S&P and any third-party providers, as well as their directors, officers, shareholders, employees or agents (collectively S&P Parties) do not guarantee the accuracy, completeness, timeliness or availability of the Content. S&P Parties are not responsible for any errors or omissions (negligent or otherwise), regardless of the cause, for the results obtained from the use of the Content, or for the security or maintenance of any data input by the user. The Content is provided on an “as is” basis. S&P PARTIES DISCLAIM ANY AND ALL EXPRESS OR IMPLIED WARRANTIES, INCLUDING, BUT NOT LIMITED TO, ANY WARRANTIES OF MERCHANTABILITY OR FITNESS FOR A PARTICULAR PURPOSE OR USE, FREEDOM FROM BUGS, SOFTWARE ERRORS OR DEFECTS, THAT THE CONTENT’S FUNCTIONING WILL BE UNINTERRUPTED OR THAT THE CONTENT WILL OPERATE WITH ANY SOFTWARE OR HARDWARE CONFIGURATION. In no event shall S&P Parties be liable to any party for any direct, indirect, incidental, exemplary, compensatory, punitive, special or consequential damages, costs, expenses, legal fees, or losses (including, without limitation, lost income or lost profits and opportunity costs or losses caused by negligence) in connection with any use of the Content even if advised of the possibility of such damages.
Credit-related and other analyses, including ratings, and statements in the Content are statements of opinion as of the date they are expressed and not statements of fact. S&P Global Market Intelligence’s opinions, analyses and rating acknowledgment decisions (described below) are not recommendations to purchase, hold, or sell any securities or to make any investment decisions, and do not address the suitability of any security. S&P Global Market Intelligence assumes no obligation to update the Content following publication in any form or format. The Content should not be relied on and is not a substitute for the skill, judgment and experience of the user, its management, employees, advisors and/or clients when making investment and other business decisions. S&P Global Market Intelligence does not act as a fiduciary or an investment advisor except where registered as such. While S&P Global Market Intelligence has obtained information from sources it believes to be reliable, S&P Global Market Intelligence does not perform an audit and undertakes no duty of due diligence or independent verification of any information it receives.
S&P keeps certain activities of its business units separate from each other in order to preserve the independence and objectivity of their respective activities. As a result, certain business units of S&P may have information that is not available to other S&P business units. S&P has established policies and procedures to maintain the confidentiality of certain non-public information received in connection with each analytical process.
S&P may receive compensation for its ratings and certain analyses, normally from issuers or underwriters of securities or from obligors. S&P reserves the right to disseminate its opinions and analyses. S&P’s public ratings and analyses are made available on its Web sites, www.standardandpoors.com (free of charge), and www.ratingsdirect.com and www.globalcreditportal.com (subscription), and may be distributed through other means, including via S&P publications and third-party redistributors. Additional information about our ratings fees is available at www.standardandpoors.com/usratingsfees.
This material is for general information purposes only and does not constitute an offer to sell, or a solicitation of an offer to buy, any security. TCW, its officers, directors, employees or clients may have positions in securities or investments mentioned in this publication, which positions may change at any time, without notice. While the information and statistical data contained herein are based on sources believed to be reliable, we do not represent that it is accurate and should not be relied on as such or be the basis for an investment decision. The information contained herein may include preliminary information and/or “forward-looking statements.” Due to numerous factors, actual events may differ substantially from those presented. TCW assumes no duty to update any forward-looking statements or opinions in this document. Any opinions expressed herein are current only as of the time made and are subject to change without notice. Past performance is no guarantee of future results. All investing involves risk including the potential loss of principal. Market volatility may significantly impact the value of your investments. Recent tariff announcements may add to this volatility, creating additional economic uncertainty and potentially affecting the value of certain investments. Tariffs can impact various sectors differently, leading to changes in market dynamics and investment performance. © 2025 TCW