

Loan Prices Climb on Demand for Floating Rate Funds and CLOs
We saw similar themes in April as we have for most of 2021. There was heavy institutional new issue volume for most of the month. Demand continued from inflows to retail funds as well as the formation of new CLOs.
Despite the $53 billion of primary deals being syndicated, loan prices continued to climb on the back of $18.5 billion of new demand from floating rate funds and CLOs. Interestingly, new issue syndication came at wider spreads relative to most of the secondary stock and at levels wide to March new issue. The stressed portion of the market remained active as buyers reached down to find value in lower-dollar priced loans. Notably, triple Cs outperformed the loan index in April and have outperformed the index 11 of the last 12 months.
In terms of ratings, S&P highlighted that upgrades of leveraged loans are outpacing downgrades at the fastest pace since 2012. Conversely, S&P downgrades outpaced upgrades at the outset of the Covid cycle. In fact, in the three months through May 2020, there were 43 downgrades for every one upgrade. This is particularly difficult for CLO managers to accept as, in rating-sensitive structures, the preemptive downgrades become most restrictive when prices are most attractive.
U.S. Leveraged Loans: Ratio of Downgrades to Upgrades
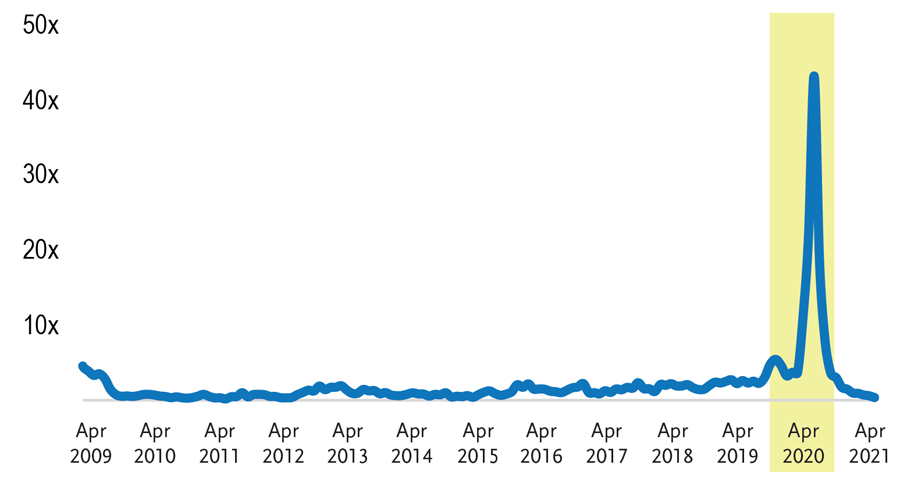
Data is rolling 3 months; data through April 30, 2021.
Sources: S&P/LSTA Leveraged Loan Index; LCD, an offering of S&P Global Market Intelligence
CS LLI Average Loan Price
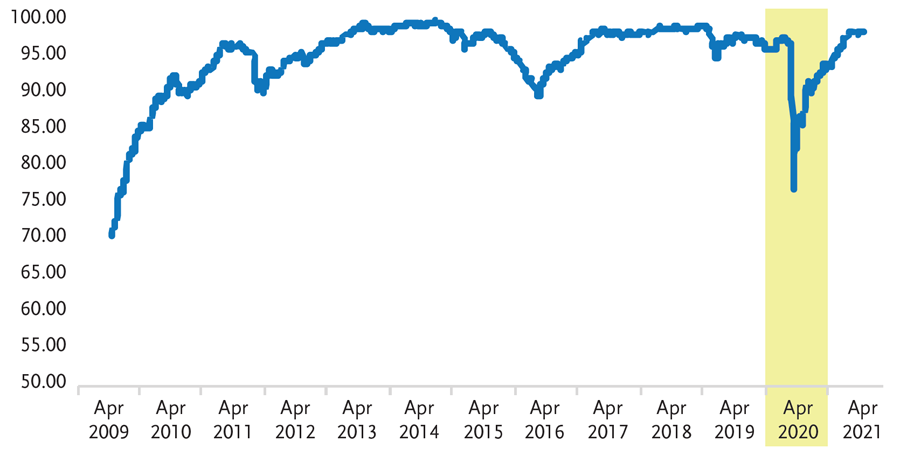
Sources: Credit Suisse Leveraged Loan Index
Performance – Loans
In April, the Credit Suisse Leveraged Loan Index (CS LLI) and the S&P Leveraged Loan Index (S&P/LSTA) were both up 0.51%. On a YTD basis, the CS LLI was up 2.53% and the S&P/LSTA advanced 2.30%.
For the 12 months ending April 30, the CS LLI was up 16.39% and the S&P/LSTA was up 16.10%.
Distressed borrowers and triple C loans outperformed all categories during the month with split triple Bs and double Bs underperforming the index.
On an LTM basis, triple Cs led all categories with nearly a 42% return. Single Bs produced a 16.35% return and double Bs returned 8.49%.
Total Return by Rating
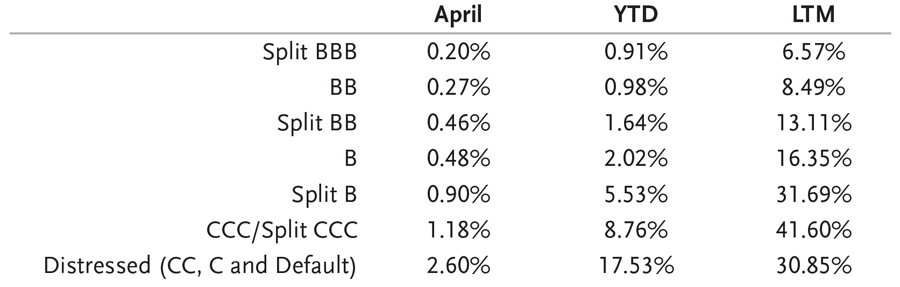
Source: Credit Suisse Leveraged Loan Index
Sector Performance
In April, all 20 sectors produced positive returns in the CS LLI. Consumer Durables led all categories while Energy and Aerospace followed close behind. The bottom performing sectors were Financials, Housing and Utility with total returns of 1.19%, 1.26% and 0.07%, respectively. The dispersion between the top and bottom sectors was similar to March with only 1.19% separating the top and bottom sectors.
In the last 12 months, Energy, Metals/Minerals and Consumer Non-durables have led all sectors with total returns of 42.77%, 27.61% and 23.64%, respectively. Interestingly, Energy went from a bottom-three returning sector during the 12 months ending February 2021 to the top returning sector in the 12 months ending in March and April 2021. Forest Products, Financials and Utility provided the worst performing sector returns: 12.14%, 11.16% and 8.5%, respectively.
Industry Returns
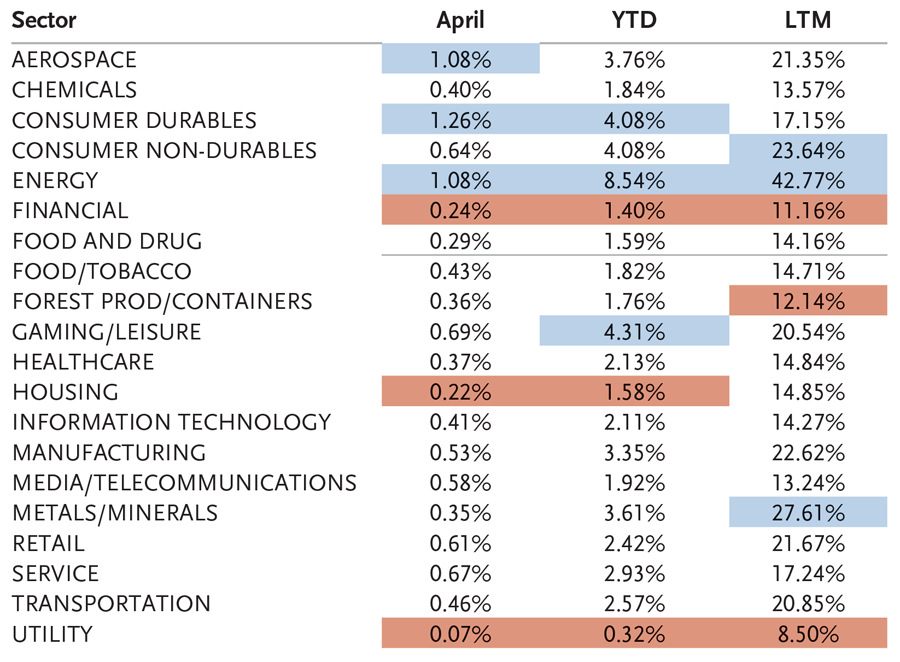
Source: Credit Suisse Leveraged Loan Index
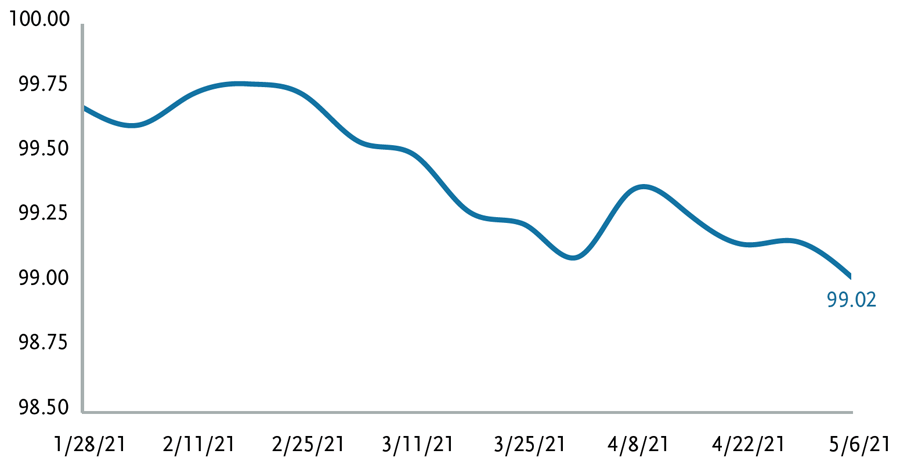
The average bid of the S&P LCD flow-name loan composite fell from 99.36 to 99.02 in early May. This is interesting because we saw the average price of the broader CS LLI increase by 15 basis points (bps). The difference comes from two dynamics. First, discounted prices generally pulled closer to par. Second, as primary issuance continued at high levels during the month, many investors needed to sell liquid loans trading near par to make room for new issue allocations.
Average Loan Flow-Name Bid
Source: LCD, an offering of S&P Global Market Intelligence
Performance – CLOs
The CLO market bounced back in April with positive returns across the stack. A slowdown in refi/reset supply in primary, helped to balance out the supply/demand dynamic leading to tighter spreads in the secondary market. CLOs returned 0.28% in April with BBB and BB performance contributing the most to overall sector returns. Lower supply, coupled with wider spreads from March and increased demand for floating rate bonds all contributed to positive performance. However, given the rally in rates over the month, CLOs underperformed IG (+1.06%) and HY (+1.09%) credit in addition to Leveraged Loans (+0.51%). Year to date, CLOs have returned 1.15%, outperforming IG credit (-3.4%) and underperforming HY credit (+1.95%) and Loans (+2.3%).
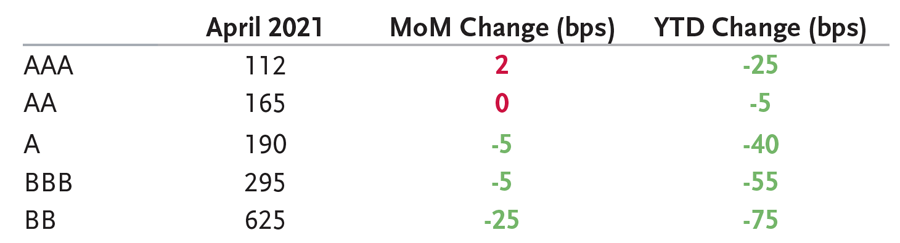
CLO AAA spreads were flat to slightly weaker over the month due to wider new issue AAA levels resulting from heavy Q1 issuance, which kept secondary levels from tightening materially. Shorter AAAs traded in the 80s-90s DM with longer AAAs at 110-115 DM. A majority of AAAs traded around par with the exception of 2020 vintage, high coupon AAAs that traded at premium levels, many on a neg DM to worst basis. AAs were ~5bps wider as many investors looked below AAs to add yield. Secondary volume in AAs was also down almost 50% from March. Single As were 5 bps tighter with most Tier 1 names trading in the mid-to-high 100s DM and very few prints wide of 215 DM.
BBBs and BBs saw the most interest during the month with spreads reversing back to 2020 tights. As refi/reset supply eased during the month, buyers found the wider BBB and BB levels from March attractive and began to bid up discount BBBs and BB in secondary. Given limited supply in secondary and primary, spreads ratcheted in quickly with most Tier 1 BBBs trading inside 300 DM, with discount BBBs in the mid-to-high 200s DM. BBs also witnessed similar demand due to wider levels vs. other securitized products and HY credit. In addition, MVOC levels remained stable and tail risk continued to decline giving buyers a level of comfort in buying BBs at tighter spreads.
Equity volume almost tripled over the month given April, being a payment-date month, tends to see a higher amount of equity trading. Equity was very well bid over the month with many bonds trading at similar levels to where they traded prior to receiving their April payment. Quarterly payments were flat to January levels with a median payment of 3.7% in April.
Overall secondary volume was flat in April with TRACE reporting $12.6 billion in trading activity split 60% IG/40% non IG. BWIC volume was slightly lower with $2.7 billion in bid list activity vs. $3.1 billion in March. All tranches, except for Equity, saw a decrease in BWIC activity over the month with AAs having the largest decline. Dealers continued to get lighter with dealers net selling over $1 billion during the month.
Secondary CLO 2.0 Total Returns
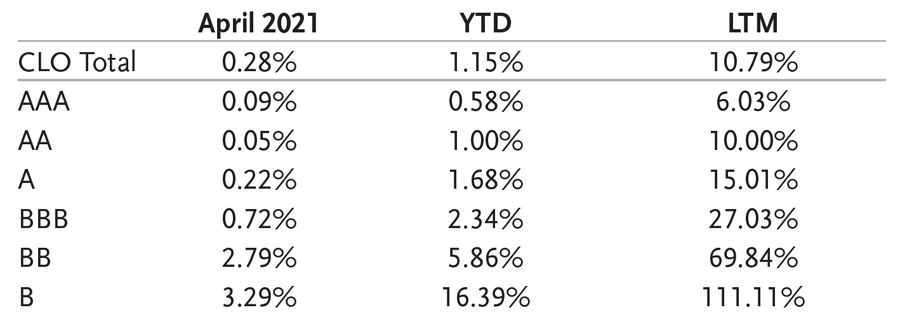
Source: J.P. Morgan CLOIE Index
Secondary CLO 2.0 Spreads (dm)
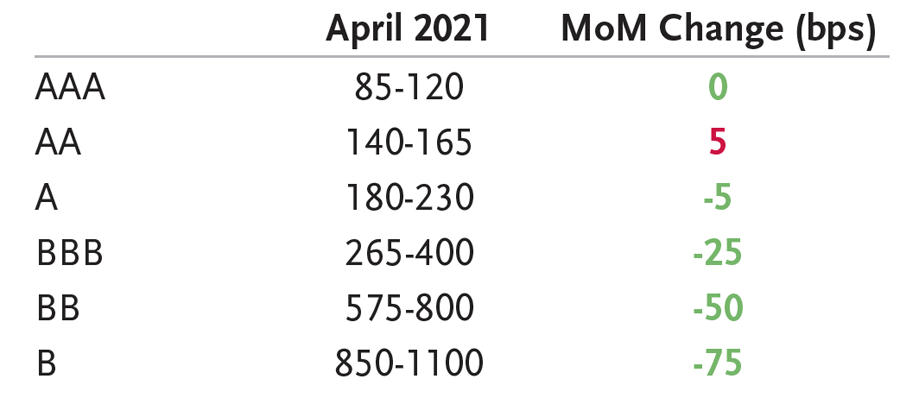
Source: TCW
Technical Conditions – CLO Primary
April CLO new issuance was flat to March with $13.6 billion pricing across 29 deals. Refi/reset activity was notable with only 31 refis and 24 resets pricing vs. 44 refis and 30 resets in March. Wider AAA spreads led to lower restructuring activity giving managers some bandwidth to focus more on their new issue pipeline. New issuance remained robust as the arb continued to remain attractive. Tier 1 AAA spreads were 2 bps wider with levels settling in around 112 DM. Mid-tier AAAs priced in the 115-120 DM range. Almost all new issues were structured with a 5-year reinvestment period but we did start to see the reemergence of Sr./Jr. AAA structures as a result of the spread widening. AA spreads widened to 170 DM by mid-month and then tightened back to March levels of 165 DM. Mezz levels were tighter month over month, as the rally in secondary mezz led to tighter primary levels. In addition, the decline in refi/reset supply helped to provide a technical tailwind to spreads. Single As tightened 5 bps to 190 DM. The basis between AAs and single As continued to narrow with only a 25 bp basis between the two tranches as single A buyers ignored the tight basis for the extra yield gained. In a reversal from the previous month, BBB demand was elevated with BBB tranches on many deals oversubscribed and pricing tighter than initial guidance. Many Tier 1 BBBs priced inside 300 DM and BBs moved to from 650 DM to 625 DM by month end.
Refi/reset spreads were weaker with shorter refi AAAs pricing in the 108-112 DM range and reset AAAs wide of 115 DM. The term curve remains very flat across the stack and at times inverts down the capital structure as par erosion and seasoned collateral is a cause for concern on refi/reset mezz. There were also three middle market deals that priced over the month vs. six in March. Most middle market deals continue to be structured with a 4-year reinvestment period with AAA spreads in the 160-170 DM context.
The weighted average cost of capital was flat over the month as wider AAA spreads were offset by tighter mezz spreads. With loan spreads flat to slightly wider due to the decline in re-pricings, the arb continued to be attractive for issuance. Moreover, with many loans issued with LIBOR floors, new issue equity returns remain well supported.
CLO New Issuance
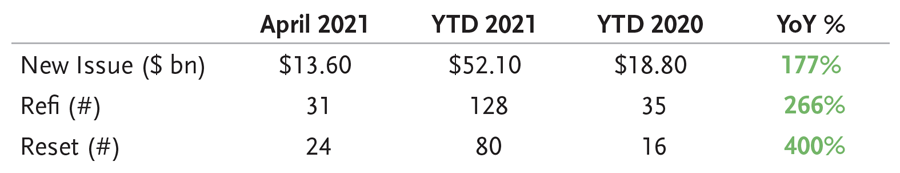
Source: TCW
Tier 1 New Issue Spreads (5nc2)
Source: TCW
Technical Conditions- Loans
In April, we saw institutional new issue decline to $52.6 billion from the prior month’s issuance of $73.4 billion. While April represented the lightest month of syndication in 2021, it outpaced any single month’s supply in 2020. On a YTD basis, 2021 represents one of the heaviest new issuance periods in years with $235.6 billion issued thus far.
Leveraged loan funds reported inflows of $5.7 billion following the first quarter’s monthly average of $4.4 billion. The past 16 weeks’ stretch of inflows for floating rate loan funds accounts for 25.9% of AUM. For context, loan funds had reported a cumulative withdrawal totaling $86 billion between October 2018 and December 2020. AUM for the dedicated leveraged loan base stands at $88 billion versus $154 billion in October 2018. Inflows for loan funds totaled +$18.2 billion for YTD April/30/21 compared to outflows in 2020 totaling -$27.0 billion.
The positive monthly demand during the last 12 months has helped contribute to the historically high returns.
Inflows vs. Returns
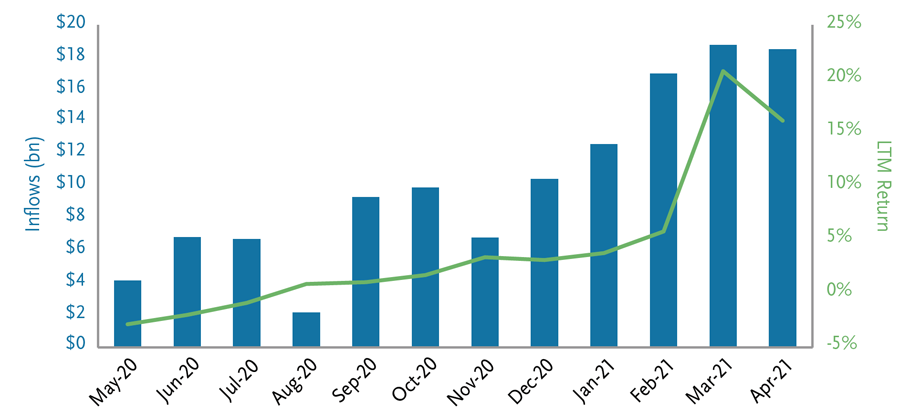
Source: LCD, an offering of S&P Global Market Intelligence
Fundamentals – Loans
Lagging 12-Month Default Rates
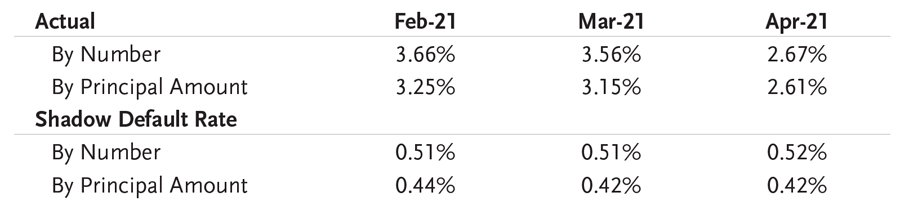
*Shadow default rate includes potential defaults, including those companies that have engaged
bankruptcy advisors, performing loans with SD or D corporate rating and those paying default interest.
Source: LCD, an offering of S&P Global Market Intelligence
There were no defaults in March or April and the last 12-month default tally for the S&P Leveraged Loan Index is only 41. Retail/ Restaurants, Services & Leasing and Oil & Gas led all industries in defaults with nine, six and six, respectively.
The default rate of the S&P/LSTA, by issuer count, dropped from 3.56% to 2.67% while the default rate based on par outstanding declined from 3.15% to 2.61%.
Fundamentals – CLOs
CLO fundamentals improved over the month as WARF levels declined and WAS remained relatively stable. As the share of CCC rated loans continued to drop, either through upgrades or via refinancings, WARF levels declined by 50 points. The share of CCC rated loans ended the month at 7% vs 7.5% in March. As a result, 20% of CLOs are failing their CCC test vs. over half in June 2020. Market value metrics improved as loan prices increased. BB MVOCs increased 50 bps and Equity NAVs increased 3 pts to $57. The share of loans trading below $80 is now only 2%, implying low default risk in the near term.
Valuation
Since 1992, the average 3-year discount margin (DM) for the CS LLI is 466 bps. If the global financial crisis (2008 & 2009) is excluded, the 3-year discount margin for the CS LLI is 426 bps. The 3-year DM finished the month at 449 bps, which was flat from the prior month.
The DM spread differential between Double Bs and Single Bs is 98 bps tighter from May 2020 to April 2021 and 43 bps tighter than the historical differential since inception.
3-Year Discount Margin Differential Between BBs and Single Bs
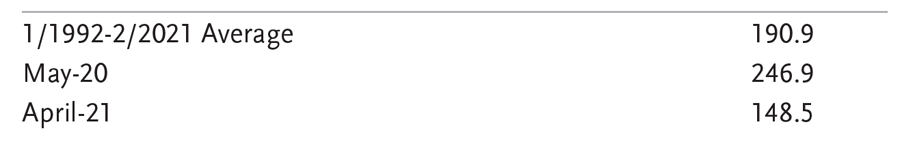
Source: Credit Suisse Leveraged Loan Index
CS LLI Snapshot
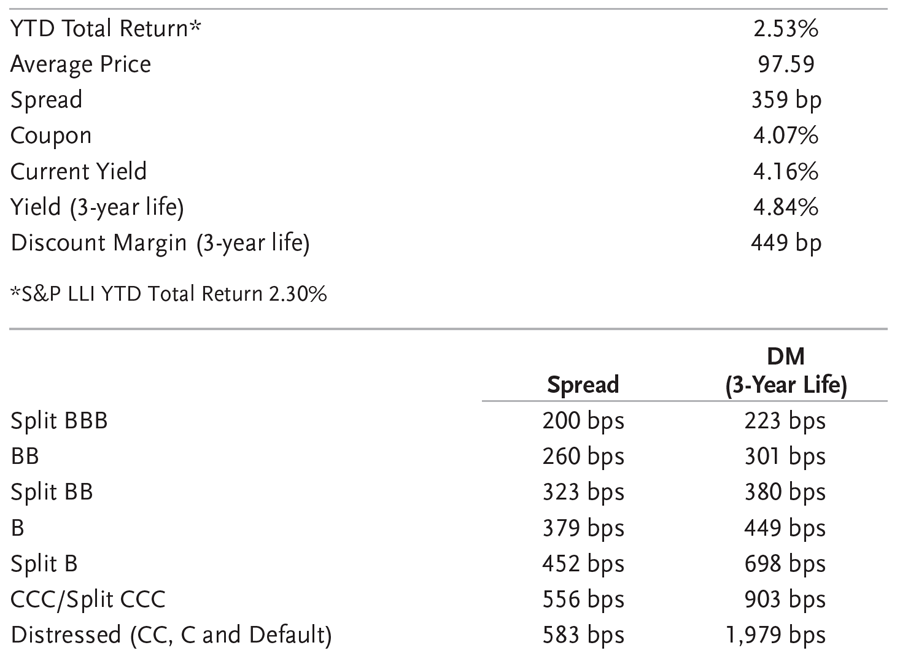
Source: Credit Suisse Leveraged Loan Index
Summary and Looking Forward
New issue spreads were wider from March to April as investors required a bigger hurdle to digest the historically large new issue calendar. As we enter May, CLO formation continues at a torrid pace while inflows continue into floating rate funds. As the market turns all eyes to concerns of inflation, it may in fact lead to an increase in floating rate inflows as investors look for alternatives. However, the problems of fiscal stimulus seem to be mounting. Employers are having a difficult time attracting talent, and the cost of commodities and goods has escalated so much that businesses will really be tested if they can pass on costs to consumers. While Q1 2021 results have largely been good, we may see Q2 2021 margins compressed.
Lower levels of refinancing and a lighter M&A pipeline have created far less supply in May. In fact, it feels as if the institutional primary calendar has disappeared. With all the demand and limited supply, loans are positioned to move higher. Equity and high yield volatility have kept that a bay thus far during the month but the underlying loan strength seems like it will inevitably push prices higher.
Disclosure
Copyright © 2025 by S&P Global Market Intelligence, a division of S&P Global Inc. All rights reserved.
No content (including ratings, credit-related analyses and data, valuations, model, software or other application or output therefrom) or any part thereof (Content) may be modified, reverse engineered, reproduced or distributed in any form by any means, or stored in a database or retrieval system, without the prior written permission of S&P Global Market Intelligence or its affiliates (collectively, S&P). The Content shall not be used for any unlawful or unauthorized purposes. S&P and any third-party providers, as well as their directors, officers, shareholders, employees or agents (collectively S&P Parties) do not guarantee the accuracy, completeness, timeliness or availability of the Content. S&P Parties are not responsible for any errors or omissions (negligent or otherwise), regardless of the cause, for the results obtained from the use of the Content, or for the security or maintenance of any data input by the user. The Content is provided on an “as is” basis. S&P PARTIES DISCLAIM ANY AND ALL EXPRESS OR IMPLIED WARRANTIES, INCLUDING, BUT NOT LIMITED TO, ANY WARRANTIES OF MERCHANTABILITY OR FITNESS FOR A PARTICULAR PURPOSE OR USE, FREEDOM FROM BUGS, SOFTWARE ERRORS OR DEFECTS, THAT THE CONTENT’S FUNCTIONING WILL BE UNINTERRUPTED OR THAT THE CONTENT WILL OPERATE WITH ANY SOFTWARE OR HARDWARE CONFIGURATION. In no event shall S&P Parties be liable to any party for any direct, indirect, incidental, exemplary, compensatory, punitive, special or consequential damages, costs, expenses, legal fees, or losses (including, without limitation, lost income or lost profits and opportunity costs or losses caused by negligence) in connection with any use of the Content even if advised of the possibility of such damages.
Credit-related and other analyses, including ratings, and statements in the Content are statements of opinion as of the date they are expressed and not statements of fact. S&P Global Market Intelligence’s opinions, analyses and rating acknowledgment decisions (described below) are not recommendations to purchase, hold, or sell any securities or to make any investment decisions, and do not address the suitability of any security. S&P Global Market Intelligence assumes no obligation to update the Content following publication in any form or format. The Content should not be relied on and is not a substitute for the skill, judgment and experience of the user, its management, employees, advisors and/or clients when making investment and other business decisions. S&P Global Market Intelligence does not act as a fiduciary or an investment advisor except where registered as such. While S&P Global Market Intelligence has obtained information from sources it believes to be reliable, S&P Global Market Intelligence does not perform an audit and undertakes no duty of due diligence or independent verification of any information it receives.
S&P keeps certain activities of its business units separate from each other in order to preserve the independence and objectivity of their respective activities. As a result, certain business units of S&P may have information that is not available to other S&P business units. S&P has established policies and procedures to maintain the confidentiality of certain non-public information received in connection with each analytical process.
S&P may receive compensation for its ratings and certain analyses, normally from issuers or underwriters of securities or from obligors. S&P reserves the right to disseminate its opinions and analyses. S&P’s public ratings and analyses are made available on its Web sites, www.standardandpoors.com (free of charge), and www.ratingsdirect.com and www.globalcreditportal.com (subscription), and may be distributed through other means, including via S&P publications and third-party redistributors. Additional information about our ratings fees is available at www.standardandpoors.com/usratingsfees.
This material is for general information purposes only and does not constitute an offer to sell, or a solicitation of an offer to buy, any security. TCW, its officers, directors, employees or clients may have positions in securities or investments mentioned in this publication, which positions may change at any time, without notice. While the information and statistical data contained herein are based on sources believed to be reliable, we do not represent that it is accurate and should not be relied on as such or be the basis for an investment decision. The information contained herein may include preliminary information and/or “forward-looking statements.” Due to numerous factors, actual events may differ substantially from those presented. TCW assumes no duty to update any forward-looking statements or opinions in this document. Any opinions expressed herein are current only as of the time made and are subject to change without notice. Past performance is no guarantee of future results. All investing involves risk including the potential loss of principal. Market volatility may significantly impact the value of your investments. Recent tariff announcements may add to this volatility, creating additional economic uncertainty and potentially affecting the value of certain investments. Tariffs can impact various sectors differently, leading to changes in market dynamics and investment performance. © 2025 TCW